THE arithmetic average is divided into two cases: simple and weighted. Each one of them has a formula for us to perform its calculation. The simple arithmetic mean is the sum of all elements divided by their number; the weighted arithmetic mean is the sum of the product of each element by its weight, divided by the sum of the weights.
calculate the average gives us a core value that represents that whole set. We work with averages, for example, to make decisions in statistics.
Read too: Probability - estimation of the chance of a given event to occur
simple arithmetic mean
The simple arimetic mean is the most common, being used many times in school to calculate the annual average of a student, or in energy and water bills, to calculate the average annual consumption or even the average amount paid monthly.
Simple arithmetic mean formula
is given by sum of all its elements dividedThe by the amount of them. The mean symbol is x with a dash at the top, for example, the mean between x1, x2, x3, … xno is calculated by the formula:

n → number of elements
How to calculate simple arithmetic mean
To calculate the simple average using the formula, we just need to know its elements and know the value of n, that is, their quantity.
Example: The maximum temperatures in the city of Goiânia were measured and noted during a week in June according to the following list:
Sunday → 28°C
Monday → 30°C
Tuesday → 29 ºC
Wednesday → 31°C
Thursday → 32°C
Friday → 33°C
Saturday → 34°C
Let's determine the average maximum temperature for this week, for that we know that there are 7 days a week, so the simple arithmetic average will be calculated by adding the 7 temperatures divided by 7.
n = 7

This means that the maximum temperature value in the city of Goiânia is, on average, 31 ºC.
weighted arithmetic mean
The weighted arimetic average requires a little more attention during its calculation. turns out there is values that matter most, so we're going to assign them weighting factors known as weight. The greater the value of this weight, the greater its influence on the mean value.
For example, in a school, the teacher assesses students on 4 criteria: participation, written test, group work and notebook activities. In this assessment, the teacher assigns the following weights:
Participation → weight 1
Notebook activities → weight 2
Written test → weight 3
Group work → weight 4
Analyzing these weights, it is clear that the grade that the student gets in group work will affect much more your average than the grade taken in participation, since the weight of group work is bigger.
Weighted arithmetic mean formula
If to a given set of values — x1, x2, x3, … xno — weights are assigned p1, P2, P3 … Pno, respectively, the weighted arithmetic mean will be calculated by sum of notes (multiplied one by one by their weights) divided by the sum of the weights.

See too: Arithmetic progression - numerical sequence that follows a given ratio
How to calculate weighted arithmetic average
To calculate the weighted average, multiply each value by its weight, then perform the addition of these results, this sum will be divided by the sum of the weights, see example:
Using the same situation as the school, the following weights are assigned:
Participation → weight 1
Notebook activities → weight 2
Written test → weight 3
Group work → weight 4
Student Amanda and student Bernardo decided to calculate their averages to find out who got the best grade.
Criterion/student |
Amanda |
Bernard |
Participation |
10 |
6 |
notebook activities |
9 |
7 |
Written test |
8 |
8 |
Group work |
7 |
10 |
Let's calculate Amanda's average:

Now we will calculate Bernardo's mean:

Bernardo's average is higher than Amanda's average.
To learn more about how this specific type of arithmetic mean is calculated, read: Mweighted average.

solved exercises
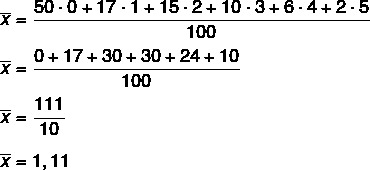
Question 1 - (Enem) The Internal Accident Prevention Commission (CIPA) of a company, observing the high costs with frequent accidents at work, made, at the request of the board, a survey of the number of accidents suffered by employees. This survey, carried out with a sample of 100 employees, will guide the company's actions in the workplace safety policy.
The results obtained are shown in the table.

The average number of accidents per employee in the sample that CIPA will present to the company's board is:
a) 0.15
b) 0.30
c) 0.50
d) 1.11
e) 2.22
Resolution
Alternative D.
Analyzing the table, we will calculate a weighted average, in which the weight is the number of workers, which we know to be equal to 100.

question 2 – During the coronavirus pandemic in 2020, it was declared that social isolation is the best alternative to delay the spread of the disease. Therefore, the energy company informed that it would no longer measure consumption and that the bill value in this period would be calculated by the average of the amount paid for the last 6 bills.
Karita is a very cautious person and, in order not to be surprised by the arrival of the bills, she decided anticipate by calculating the average of the previous 6 months to predict the value of the next invoice. Knowing that the values of the last 6 invoices are:
1 - BRL 150
2 - BRL 120.50
3 - BRL 151.25
4 - BRL 163.15
5 - BRL 142.10
6 - BRL 130
What will the amount paid for her on the next bill?
a) BRL 143
b) R$ 144
c) BRL 145
d) BRL 146
e) BRL 150
Resolution
Alternative A.
Calculating the arithmetic mean, we have:


