THE statistic is the field of mathematics that lists facts and figures in which there is a set of methods that enable us to collect data and analyze them, thus making it possible to perform some interpretation of them. The statistic is divided into two parts: descriptive and inferential. Descriptive statistics is characterized by the organization, analysis and presentation of data, while inferential statistics have as a characteristic the study of a sample of a given population and, based on it, the performance of analyzes and the presentation of Dice.
Read too: What is a survey's margin of error?
Principles of Statistics
Next, we will see the main concepts and principles of statistics. Based on them, it will be possible to define more sophisticated concepts.
population or statistical universe
The population or statistical universe is the set formed by all elements who participate in a particular researched topic.
Examples of statistical universe
a) In a city, all inhabitants belong to the statistical universe.
b) On a six-sided die, the population is given by the number of faces.
{1, 2, 3, 4, 5, 6}
statistical data
The statistical data is a element that belongs to the population as a whole, obviously this data must be involved with the research theme.
Population |
statistical data |
six-sided dice |
4 |
Brazilian Mountain Bike Champions |
Henrique Avancini |
Sample
We call the sample the subset formed based on statistical universe. A sample is used when the population is very large or infinite. In cases where collecting all the information from the statistical universe is unfeasible for financial or logistical reasons, it is also necessary to use samples.
The choice of a sample is extremely important for a survey, and it must reliably represent the population. A classic example of the use of samples in a survey is in carrying out the demographic census of our country.
Variable
In statistics, the variable is the object of study, that is, the topic that the research intends to study. For example, when studying the characteristics of a city, the number of inhabitants can be a variable, as well as the volume of rain in a given period or even the number of buses for transport public. Note that the concept of variable in statistics is dependent on the research context.
The organization of data in statistics takes place in phases, as in any organization process. Initially, the topic to be researched is chosen, then the method for collecting the research data is thought out, and the third step is to carry out the collection. After the end of this last step, the analysis of what was collected is carried out, and thus, based on the interpretation, results are sought. We will now see some important and necessary concepts for data organization.
Do not stop now... There's more after the advertising ;)
role
In cases where the data can be represented by numbers, that is, when the variable is quantitative, the list for organization of these data. A roster can be ascending or descending. If a variable is not quantitative, that is, if it is qualitative, it is not possible to use the list, for example, if the data are feelings about a particular product.
Example
In a classroom, the heights of students in meters were collected. They are: 1.70; 1,60; 1,65; 1,78; 1,71; 1,73; 1,72; 1,64.
As the list can be organized in an ascending or descending way, it follows that:
rol: (1.60; 1,64; 1,65; 1,70; 1,71; 1,72; 1,73; 1,78}
Note that, with the roll already assembled, it is possible to find data more easily.
Frequency distribution table
In cases where there are many elements in the list and many repetitions of data, the list becomes obsolete, as the organization of these data is impracticable. In these cases, the tables and the frequency distribution they serve as an excellent organizational tool.
In the distribution table of absolute frequency, we must put the frequency at which each data appears, that is, the number of times it appears.
Let's build the distribution table for absolute frequency the ages, in years, of the students in a given class.
Absolute frequency distribution | |
Age |
Frequency (F) |
8 |
2 |
9 |
12 |
10 |
12 |
11 |
14 |
12 |
1 |
Total (FT) |
41 |
From the table we can get the following information: in the class we have 2 students aged 8, 12 9-year-old students, and 12 more 10-year-old students, and so on, reaching a total of 41 students. In the distribution table of accumulated frequencies, we must add the frequency from the previous row (in the absolute frequency distribution table).
Let's build the cumulative frequency distribution table for ages of the same class as in the previous example, see:
Accumulated frequency distribution | |
Age |
Frequency (F) |
8 |
2 |
9 |
14 |
10 |
26 |
11 |
40 |
12 |
41 |
Total (FT) |
41 |
In the table of distribution of relative frequencies, the percentage in which each data appears is used. Again we will do the calculations based on the absolute frequency distribution table. We know that 41 corresponds to 100% of the students in the class, so to determine the percentage of each age, we just divide the frequency of the age by 41 and multiply the result by 100, so that we can write it as a percentage.
2: 41 = 0,048 · 100 → 4,8%
12: 41 = 0,292 · 100 → 29,2%
12: 41 = 0,292 · 100 → 29,2%
14: 41 = 0,341 · 100 → 34,1%
1: 41 = 0,024 · 100 → 2,4%
Relative frequency distribution | |
Age |
Frequency (F) |
8 |
4,8% |
9 |
29,2% |
10 |
29,2% |
11 |
34,1% |
12 |
2,4% |
Total (FT) |
100% |
Read too:Application of andstatistics: ffrequency Theabsolute and frelative frequency
Classes
In cases where the variable is continuous, that is, when it has several values, it is necessary to group them in real intervals. In statistics these intervals are called classes..
To build the table of frequency distribution in classes, we must put the intervals in the left column, with their proper title, and in the right column, we must put the absolute frequency of each of the intervals, that is, how many elements belong to each one their.
Example
Height of students in the 3rd year of high school at a school.
Frequency distribution in classes | |
height (meters) |
Absolute frequency (F) |
[1,40; 1,50[ |
1 |
[1,50; 1,60[ |
4 |
[1,60; 1,70[ |
8 |
[1,70; 1,80[ |
2 |
[1,80; 1,90[ |
1 |
Total (FT) |
16 |
Analyzing the frequency distribution table in classes, we can see that, in the third year class, we have 1 student which has a height between 1.40 m and 1.50 m, just as we have 4 students with a height between 1.50 and 1.60 m, and so successively. We can also observe that students have height between 1.40 m and 1.90 m, the difference between these measurements, that is, between the highest and the lowest height of the sample, is called amplitude.
The difference between the upper and lower bounds of a class is called the class breadth, thus, the second, which has 4 students with heights between 1.50 meters (included) and 1.60 meters (not included), has a range of:
1,60 – 1,50
0.10 meter
See too: Dispersion measures: amplitude and deviation
position measurements
Position measures are used in cases where it is possible to build a numerical roll with the data or a frequency table. These measurements indicate the position of the elements in relation to the roster. The three main measures of position are:
Average
Consider the list with the elements (a1, a2, a3, a4, …, Theno), the arithmetic mean of these n elements is given by:

Example
In a dance group, the ages of the members were collected and represented in the following list:
(18, 20, 20, 21, 21, 21, 22, 22, 25, 30)
Let's determine the average age of the members of this dance group.
According to the formula, we must add all the elements and divide this result by the number of elements in the list, like this:
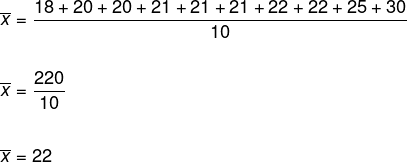
Therefore, the average age of the members is 22 years old.
To learn more about this position measure, read our text: Mémorning.
median
The median is given by the central element of a roster that has an odd number of elements. If the list has an even number of elements, we must consider the two central elements and calculate the arithmetic mean between them.
Example
Consider the following list.
(2, 2, 3, 3,4, 5, 6, 7, 9)
Note that element 4 divides the role into two equal parts, so it is the central element.
Example
Calculate the median age of the dance group.
Remember that the list of ages for this dance group is given by:
(18, 20, 20, 21, 21, 21, 22, 22, 25, 30)
Note that the number of elements in this list is equal to 10, so it is not possible to divide the list into two equal parts. So we must take two central elements and perform the arithmetic mean of these values.

See more details of this position measure in our text: Median.
Fashion
We will call fashion the element of the role that has the highest frequency, that is, the element that appears most in it.
Example
Let's determine the fashion of the dance group's age roll.
(18, 20, 20, 21, 21, 21, 22, 22, 25, 30)
The element that appears the most is 21, so the mode is equal to 21.
Dispersion measures
Dispersion measures are used in cases where the average is no longer sufficient. For example, imagine that two cars have covered an average of 40,000 kilometers. Only with knowledge about averages can we say that the two cars walked determinable kilometers each, right?
However, imagine that one of the cars has covered 79,000 kilometers, and the other 1,000 kilometers, note that only with information about average it is not possible to make statements with precision.
At dispersion measures will tell us how far the elements of a numerical list are from the arithmetic mean. We have two important measures of dispersion:
Variance (σ2)
Let's call the arithmetic mean of the squares of the difference between each element in the roll and the arithmetic mean of that roll as the variance. The variance is represented by: σ2.
Consider the list (x1, x2, x3, …, xno) and that it has arithmetic meanx. The variance is given by:

Standard deviation (σ)
The standard deviation is given by the root of the variance, it tells us how much an element is dispersed in relation to the mean. The standard deviation is denoted by σ.
Example
Determine the standard deviation of the data set (4, 7, 10). Note that, for this, it is necessary to determine the variance first, and that, for that, it is necessary to first calculate the average of these data.
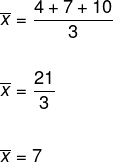
Replacing these data in the variance formula, we have:
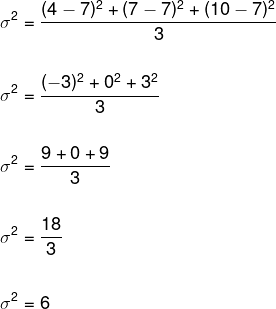
To determine the standard deviation, we must extract the root of the variance.

Read more: Dispersion measures: variance and standard deviation
What is statistics for?
We saw that the statistic is related to Counting or Data Organization Problems. In addition, it has an important role in the development of tools that enable the data organization process, such as in tables. Statistics are also present in various fields of science, based on data collection and treatment, it is possible to work with mathematical models that allow for further development in the area studied. Some fields in which statistics are fundamental: economics, meteorology, marketing, sports, sociology and geosciences.
In meteorology, for example, data are collected in a certain period, after being organized, they are treated, and so, with based on them, a mathematical model is built that allows us to assert about the climate of previous days with a greater degree of reliability. Statistics is a branch of science that allows us to make statements with some degree of reliability, but never 100% certainty.
Statistic divisions
Statistics is divided into two parts, descriptive and inferential. The first is related to counting the elements involved in the research, these elements are counted one by one. At Descriptive statistics, our main tools are position measures, such as mean, median and mode, as well as dispersion measures such as variance and standard deviation, we also have frequency tables and graphics.
Still in descriptive statistics, we have a very well-defined methodology for a presentation of data with a considerable degree of reliability which goes through organization and collection, summary, interpretation and representation and, finally, data analysis. A classic example of the use of descriptive statistics occurs in the population census (every 10 years) by the Brazilian Institute of Geography and Statistics (IBGE).
THE inferential statistics, in turn, it is characterized not by collecting data from the elements of a population one by one, but by carrying out the analysis of a sample of this population, drawing conclusions about her. In inferential statistics, care must be taken when choosing the sample, as it must represent the population very well. Some initial results, such as averaging, in inferential statistics called hope, are deduced based on knowledge of descriptive statistics.
Inferential statistics are used, for example, in electoral polls. A sample of the population is chosen, in a way that represents it, and thus the research is carried out. When choosing a sample that does not represent this population very well, we say that the research is biased and therefore unreliable.

solved exercises
question 1 – (U. F. Juiz de Fora – MG) A physics teacher applied a test, worth 100 points, to his 22 students and obtained, as a result, the distribution of grades, seen in the following table:
40 |
20 |
10 |
20 |
70 |
60 |
90 |
80 |
30 |
50 |
50 |
70 |
50 |
20 |
50 |
50 |
10 |
40 |
30 |
20 |
60 |
60 |
– |
– |
Perform the following data treatments:
a) Write the list of these notes.
b) Determine the relative frequency of the highest note.
Resolution
a) To make the list of these notes, we must write them in ascending or descending way. So we have to:
10, 10, 20, 20, 20, 20, 30, 30, 40, 40, 50, 50, 50, 50, 50, 60, 60, 60, 80, 90
b) Looking at the roll, we can see that the highest note was equal to 90 and that its absolute frequency is equal to 1, as it appears only once. To determine the relative frequency, we must divide the absolute frequency of that note by the total frequency, in this case equal to 22. Thus:
relative frequency

To pass this number as a percentage, we must multiply it by 100.
0,045 · 100
4,5%
Question 2 – (Enem) After rolling a cube-shaped die with faces numbered from 1 to 6, 10 consecutive times, and note the number obtained in each move, the following table of distribution of frequencies.
Number obtained |
Frequency |
1 |
4 |
2 |
1 |
4 |
2 |
5 |
2 |
6 |
1 |
The mean, median and mode of this frequency distribution are, respectively:
a) 3, 2 and 1
b) 3, 3 and 1
c) 3, 4 and 2
d) 5, 4 and 2
e) 6, 2 and 4
Resolution
Alternative B.
To determine the mean, note that there is repetition of the numbers obtained, so we will use the weighted arithmetic mean.
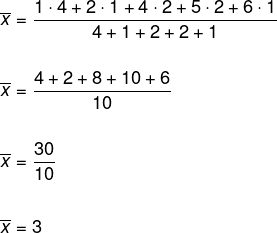
To determine the median, we must arrange the roster in an ascending or descending way. Remember that frequency is the number of times the face appears.
1, 1, 1, 1, 2, 4, 4, 5, 5, 6
As the number of elements in the roster is even, we must calculate the arithmetic mean of the central elements that divide the roster in half to determine the median, like this:

The mode is given by the element that appears the most, that is, it has the highest frequency, so we have that the mode is equal to 1.
Thus, the mean, the median and the mode are, respectively, equal to:
3, 3 and 1
by Robson Luiz
Maths teacher
In a group of people, the ages are: 10, 12, 15 and 17 years old. If a 16-year-old joins the group, what happens to the average age of the group?
Calculate the average salary for that company.

