The study and development of Statistics require organizational planning, due to the significant importance of research. The English mathematician John Venn, created a diagram representation system in order to determine unions and intersections, facilitating the organization and interpretation of researched data.
The representation through these diagrams was named Venn Diagrams in return for their great contribution to mathematics.
Using the Venn diagram
Look at the example:
A survey on the preference of readers in a city in relation to newspapers A, B and C was carried out. 360 readers were interviewed among men and women over 18 years of age. The data collected in the survey were as follows:
120 read the newspaper A.
170 read the newspaper B.
150 read the newspaper C.
40 read the newspaper A and B.
15 read newspapers A and C.
30 read newspapers B and C.
05 read newspapers A, B and C.
How many readers prefer to read only newspaper A?
Resolution:
Let's use Venn diagrams to represent the survey data.
Do not stop now... There's more after the advertising ;)
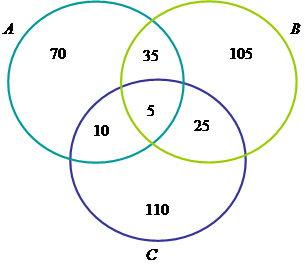
We can conclude from the diagram that 70 readers prefer only newspaper A.
Example 2
We can use Venn diagrams to represent numerical sets in Mathematics.
N: set of Natural numbers
Z: set of integer numbers
Q: set of Rational numbers
I: set of irrational numbers
R: set of real numbers
C: set of Complex numbers
by Mark Noah
Graduated in Mathematics
Would you like to reference this text in a school or academic work? Look:
SILVA, Marcos Noé Pedro da. "Venn Diagrams in Statistics"; Brazil School. Available in: https://brasilescola.uol.com.br/matematica/diagramas-venn-na-estatistica.htm. Accessed on June 27, 2021.