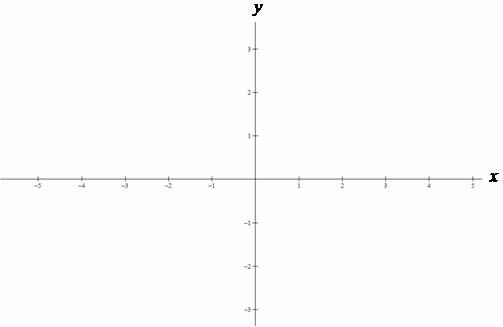
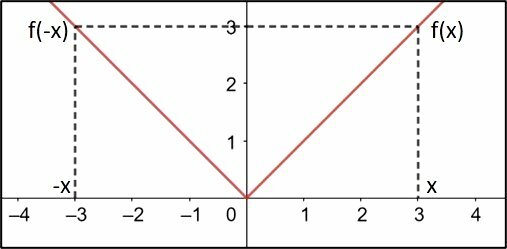
The parabola is the graph of the function of the second degree (f (x) = ax2 + bx + c), also called a quadratic function. It is drawn on the Cartesian plane, which has x (abscissa = x-axis) and y (ordinate = y-axis) coordinates.
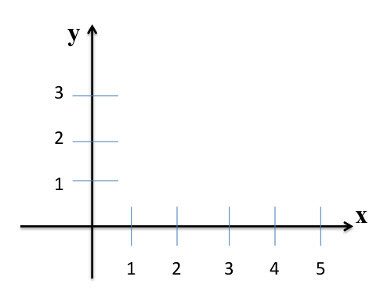
To trace the graph of a quadratic function, you need to find out how many real roots or zeros the function has with respect to the x-axis. Understand roots as the solution of the equation of the second degree that belongs to the set of real numbers. In order to know the number of roots, it is necessary to calculate the discriminant, which is called delta and is given by the following formula:
The discriminant/delta formula is made in relation to the coefficients of the second degree function. Therefore, The, B and ç are the coefficients of the function f (x) = ax2 + bx + c .
There are three relationships of the parabola with the delta of the function of the second degree. These relationships establish the following conditions:
First condition:When Δ > 0, the function has two different real roots. The parabola will intersect the x-axis at two distinct points.
Second condition: When Δ = 0, the function has a single real root. The parabola has only one point in common, which is tangent to the x-axis.
Third condition: When Δ < 0, the function has no real root; therefore, the parabola does not intersect the x-axis.
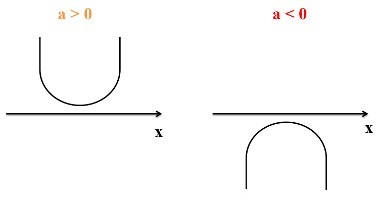
concavity of the parable
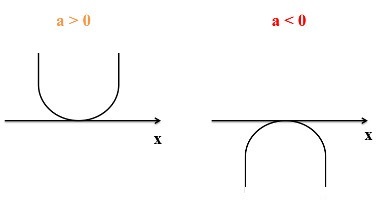
What determines the concavity of the parable is the coefficient The of the second degree function - f (x) = Thex2 + bx + c. The parabola has the concavity facing upwards when the coefficient is positive, that is, The > 0. If negative (The < 0), the concavity is facing down. To better understand the conditions established above, note the outlines of the following parables:
For Δ > 0:

For Δ = 0:
For Δ < 0.
Let's practice the concepts learned, see the examples below:
Example: Find the discriminant of each second-degree function and determine the number of roots, the concavity of the parabola, and plot the function with respect to the x-axis.
Do not stop now... There's more after the advertising ;)
The) f (x) = 2x2 – 18
B) f(x) = x2 – 4x + 10
ç) f (x) = - 2x2 + 20x – 50
Resolution
The) f(x) = x2 – 16
Initially, we must check the coefficients of the second degree function:
a = 2, b = 0, c = - 18
Replace the coefficient values in the discriminant/delta formula:

Since delta is equal to 144, it is greater than zero. Thus, the first condition applies, that is, the parabola will intersect the x-axis at two distinct points, that is, the function has two different real roots. Since the coefficient is greater than zero, the concavity is up. The graphic outline is below:
B) f(x) = x2 – 4x + 10
Initially, we must check the coefficients of the second degree function:
a = 1, b = - 4, c = 10
Replace the coefficient values in the discriminant/delta formula:

The discriminant value is - 24 (less than zero). With that, we apply the third condition, that is, the parabola does not intersect the x-axis, so the function does not have any real root. Since a > 0, the concavity of the parabola is up. Look at the graphic outline:
ç) f (x) = - 2x2 + 20x – 50
Initially, we must check the coefficients of the second degree function.
a = - 2, b = 20, c = - 50
Replace the coefficient values in the discriminant/delta formula:

The value of delta is 0, so the second condition applies, that is, the function has a single real root, and the parabola tangents to the x-axis. Since a < 0, the concavity of the parabola is down. See the graphic outline:
By Naysa Oliveira
Graduated in Mathematics
Would you like to reference this text in a school or academic work? Look:
OLIVEIRA, Naysa Crystine Nogueira. "Relation of the parabola with the delta of the second degree function"; Brazil School. Available in: https://brasilescola.uol.com.br/matematica/relacao-parabola-com-delta-funcao-segundo-grau.htm. Accessed on June 28, 2021.

