Electronic distribution refers to how electrons are distributed in the layers or energy levels that surround the nucleus of the atom.
According to the Rutherford-Böhr atomic model, the atoms of known chemical elements have at most seven electronic layers, which increase in energy from the inside to the outside of the core (1 – 2 – 3 – 4 – 5 – 6 – 7). These seven layers can also be designated by the respective letters K – L – M – N – O – P – Q, with K being the first, being closer to the nucleus and having the lowest energy. On the other hand, the Q layer is the seventh, being the furthest from the core and the one with the highest energy.
Since each atom has an atomic number (amount of protons in the nucleus) and a different number of electrons, the electron layers of each atom have different energies that hold electrons with that energy determined.
Mind Map: Electronic Distribution

* To download the mind map in PDF, Click here!
Note below some atoms and electrons distributed in their electronic layers:

Hydrogen, helium, beryllium and oxygen atom
Note that the distribution of the four atoms of beryllium is: 2 – 2, and that of oxygen is 2 – 6. Only through these examples is it possible to see that electronic distribution follows an order. For example, the K (1) shell can have a maximum of two electrons.
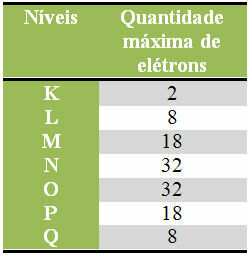
Below we have a table that specifies the maximum amount of electrons that can be distributed in each electronic layer:

Maximum number of electrons in electronic levels
It should also be remembered that the last shell to be filled, the so-called valence shell, must have a maximum of eight electrons. So if you distributed the electrons and saw that the last shell had a quantity greater than 8, but smaller that 18, then, should leave only 8 electrons in that shell and add the rest in the next shell plus external.
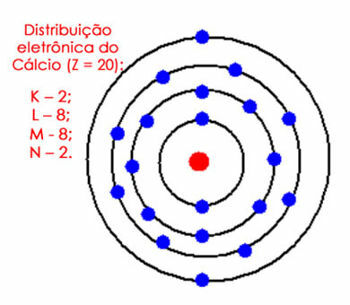
For example, consider the electronic distribution of the calcium atom. Looking at the periodic table, we see that it has an atomic number equal to 20, whereas, in the ground state, there are the same number of electrons. So, we have to distribute 20 electrons in their electron shells. See it below:

Electronic distribution of calcium in the atom
Note that the M shell can hold up to 18 electrons, but if we put the remaining electrons in it, it would have 10 electrons, which cannot happen in the valence shell. So we put the other electrons (2) in the next shell, which is N.
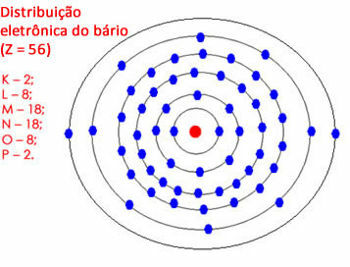
But if the amount of electrons in the last shell is between 18 and 32, you leave 18 electrons and pass the rest to the outer shells. See another example:

Electronic distribution of barium in the atom
Note that the “N” shell can contain a maximum of 32 electrons, but here it would have 28. So we leave 18 electrons and pass the rest to the next shell. But the “O” shell would have 10 electrons, so we left 8 and distributed the other 2 remaining electrons to the “P” shell.
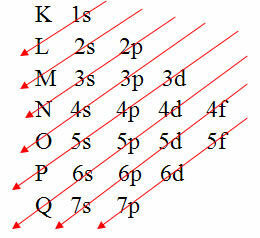
However, there is an easier way to carry out this electronic distribution of an atom's electrons. It is through the Pauling diagram (since it was created by scientist Linus Carl Pauling (1901-1994)), also known as electronic distribution diagram or yet, Diagram of energy levels. This diagram looks like this:

The graphical representation of the electronic distribution is given by the Pauling Diagram
To understand how the electronic distributions of electrons and ions are made in this diagram, read the texts below:
* electron distribution;
* electronic ion distribution.
* Image credit from Linus Pauling: Nobelprize.org
** Mind Map by Me. Diogo Lopes
By Jennifer Fogaça
Graduated in Chemistry
Source: Brazil School - https://brasilescola.uol.com.br/o-que-e/quimica/o-que-e-distribuicao-eletronica.htm

