THE Linear Function is a function f: ℝ→ℝ defined as f(x) = a.x, being a a real and non-zero number. This function is a particular case of the affine function. f (x) = a.x + b, when b = 0.
The number The that follows the x of the function, is called the coefficient. When its value is equal to 1, the linear function will also be called the identity function.
Example
Watches are sold in a store, the sale price of which is equal to R$ 40.00. The value of the total revenue from the sale of these watches is obtained by multiplying the price of each unit by the quantity sold. considering x the quantity sold, determine:
a) a function that represents the situation described.
b) the type of function found.
c) the amount of revenue when 350 watches are sold.
Solution
a) The value of total revenue as a function of the quantity sold can be represented by: f (x) = 40.x
b) The function found is a 1st degree function, where the value of b = 0. In this way it is a linear function.
c) To find the revenue corresponding to the sale of 350 watches, just replace this value in the expression found. Thus:
f(x) = 40. 350 = 14 000
Therefore, when selling 350 watches, the store's gross revenue will be equal to BRL 14 000.00.
Linear Function Graph
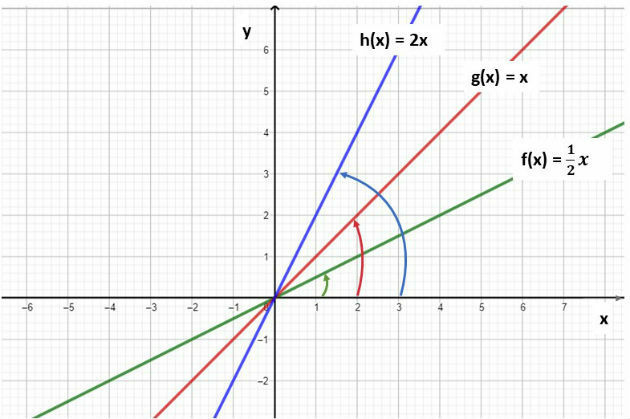
The graph of the linear function is a straight, which passes through the origin, that is, through the point (0,0). the coefficient The of the function, corresponds to the slope of this line.
Below, we represent the function f (x) = 1/2x, g (x) = x (identity function) and h (x) = 2x. Note that the greater the value of a, the greater the slope of the line.

Ascending and Descending Function
Linear functions will increase when we increase the value of x, the value of the function also increases. On the other hand, they will be decreasing when increasing the x the function will decrease.
To know whether a linear function is increasing or decreasing, it is enough to identify the sign of the coefficient. if The is positive, the function will be increasing, if it is negative it will be decreasing.
Below, we present the graph of the function f (x) = 3/2.x and g (x) = - 3/2.x:

Solved Exercises
1. (Fuvest) The function that represents the amount to be paid after a 3% discount on the x value of a good is:
a) f (x) = x - 3
b) f (x) = 0.97x
c) f (x) = 1.3x
d) f (x) = -3x
e) f (x) = 1.03x
Alternative b) f (x) = 0.97x
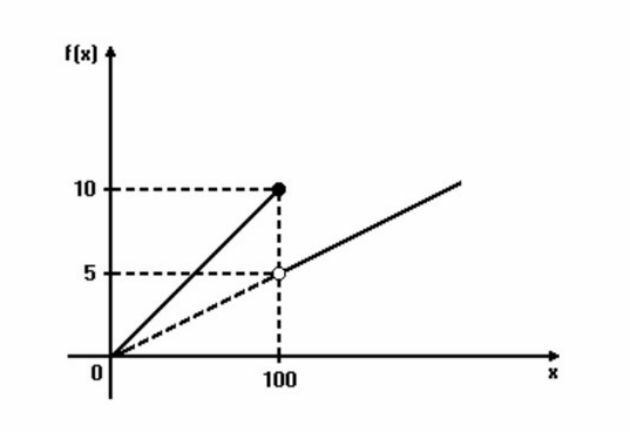
2.(Fatec) The following figure shows the graph of the function f, where f (x) represents the price paid in reais for x copies of the same original, in Copiadora Reprodux.

According to the graph, it is true that the price paid on this Copier per
a) 228 copies of the same original is R$22.50.
b) 193 copies of the same original is R$9.65.
c) 120 copies of the same original is R$7.50.
d) 100 copies of the same original is R$5.00
e) 75 copies of the same original is R$8.00.
Alternative: b) 193 copies of the same original is R$9.65.
To learn more, read also:
- Affine Function
- Modular Function
- Quadratic Function
- Quadratic Function - Exercises
- Exponential Function
- Related Function Exercises
- High School Equation - Exercises
- Exponential Function - Exercises
- Math Formulas


