Issues involving graphic scales and cartographic scales are very frequent in competitions and entrance exams across the country.
Below is a series of exercises on cartographic scales found in college entrance exams throughout Brazil with commented answers.
Question 1 (Unicamp)
Scale, in cartography, is the mathematical relationship between the real dimensions of the object and its representation on the map. Thus, on a 1:50,000 scale map, a city that is 4.5 km long between its extremes will be represented with
a) 9 cm.
b) 90 cm.
c) 225 mm.
d) 11 mm.
Correct alternative: a) 9 cm.
The data in the statement show that the city is 4.5 km long and the scale is from 1 to 50,000, that is, for the representation on the map, the actual size has been reduced by 50,000 times.
To find the solution, it will have to reduce the city's 4.5 km length in the same proportion.
Thus:
4.5 km = 450,000 cm
450,000: 50,000 = 9 ⇒ 50,000 is the denominator of the scale.
Final answer: the extension between the extremes of the city will be represented with 9 cm.
Question 2 (Mackenzie)
Considering that the real distance between Yokohama and Fukushima, two important locations, where they will be held competitions of the Summer Olympic Games 2020 is 270 kilometers, on a map, on the scale of 1:1,500,000, that distance would be
a) 1.8 cm
b) 40.5 cm
c) 1.8 m
d) 18 cm
e) 4.05 m
Correct alternative: d) 18 cm.
When there is no kind of reference to the unit of measure of a scale, it is understood as given in centimeters. In the question, each centimeter in the map representation will have to represent 1,500,000 of the actual distance between cities.
Thus:
270 km = 270,000 m = 27,000,000 cm
27.000.000: 1.500.000 = 270: 15 = 18
Final answer: the distance between cities on the scale of 1:1,500,000 would be 18 cm.
Question 3 (UFPB)
Graphic scale, according to Vesentini and Vlach (1996, p. 50), "is the one that directly expresses the values of reality mapped in a graph located at the bottom of a map". In this sense, considering that the scale of a map is represented as 1:25000 and that two cities, A and B, in this map, are 5 cm apart from each other, the real distance between these cities is:
a) 25,000 m
b) 1,250 m
c) 12,500 m
d) 500 m
e) 250 m
Correct alternative: b) 1,250 m.
In this question, the scale value is given (1:25.000) and the distance between cities A and B on the map representation (5 cm).
To find the solution, you will have to determine the distance equivalent and convert it to the requested measurement unit.
Thus:
25,000 x 5 = 125,000 cm
125,000 = 1,250 m
Final answer: the actual distance between cities is 1,250 meters. If the alternatives were in kilometers, the conversion would give 1.25 km.
Question 4 (UNESP)
The cartographic scale defines the proportionality between the terrain surface and its representation on the map, and can be presented graphically or numerically.
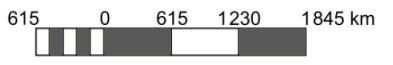
The numerical scale corresponding to the graphic scale shown is:
a) 1:184 500 000.
b) 1:615,000.
c) 1:1 845 000.
d) 1:123,000,000.
e) 1:61 500 000.
Correct alternative: e) 1:61 500 000.
In the given graphic scale, each centimeter is equivalent to 615 km and what is required is the conversion of the graphic scale into a numerical scale.
For this, it is necessary to apply the conversion rate:
1 km = 100,000 cm
The rule of three 1 is to 100,000 applies, just as 615 is to x.
x = 61,500,000
Final answer: the numerical scale corresponding to the graphic scale presented is 1:61.500.000.
Question 5 (PUC-RS)
INSTRUCTION: Imagine that you have in front of you two maps that represent the urban area of the Municipality of Porto Alegre, according to the following scales:
• Map 1 – 1:50,000 scale
• Map 2 – scale 1:1,000,000
Based on these data, it is correct to state that:
a) In both maps there is a representation rich in details, which facilitates the reading of the urban elements that constitute the city.
b) The scale of map 1 is most recommended for planispheres that are part of school atlases.
c) A 1:500 scale map allows the representation of the urban area of Porto Alegre with more details than maps 1 and 2.
d) Map 2, as it is larger than map 1, is more favorable to the representation of details than the latter.
e) The richness of detail that a map can represent does not depend on the scale, but on the quality of the legend.
Correct alternative: c) A 1:500 scale map makes it possible to represent the urban area of Porto Alegre in more detail than maps 1 and 2.
The larger the scale of a map, the less possible it is to represent details.
In the question, Map 1 (1:50,000) has a smaller scale than Map 2 (1:1,000,000) and the map proposed in alternative "c" would be of an even smaller scale (1:500), allowing for a greater degree of detail.
Thus, in the event of greater detail, the order would be:
- 1st 1:500 scale map (alternative c) - more detailed;
- 2nd Map 1 (1:50,000 scale) - intermediate;
- 3rd Map 2 (scale 1:1,000,000) - less possibility of detailing.
Question 6 (UFRGS)
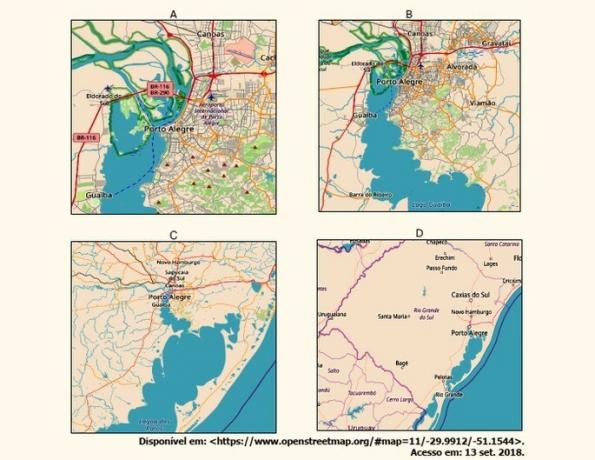
Considering the sequence of images above, from A to D, it can be said that
a) the scale of the images decreases as more details can be seen in the sequence.
b) image details decrease in the sequence from A to D, and the represented area increases.
c) the scale increases in the sequence of images, since there is, in image D, a larger area.
d) the detail of image A is greater, therefore its scale is smaller than that of the later images.
e) the scale changes little, as there is the same area represented from A to D.
Correct alternative: b) image details decrease in the sequence from A to D, and the represented area increases.
In a graphical representation, the verbosity is inversely proportional to the scale size.
In other words, the larger the scale, the less detail possible.
Thus, image A has more details and a smaller scale, while image D has less detail and a larger scale.
Question 7 (UERJ)
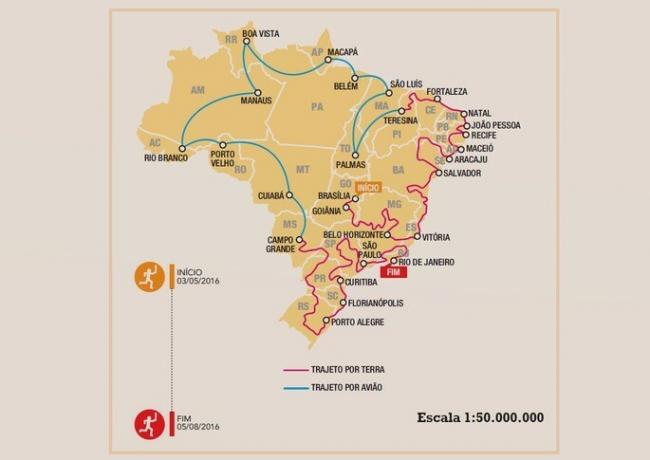
On the map, the total path of the Olympic torch in Brazilian territory measures about 72 cm, considering the sections by air and by land.
The actual distance, in kilometers, traveled by the torch in its complete path, is approximately:
a) 3600
b) 7 000
c) 36 000
d) 70 000
Correct alternative: c) 36 000
The scale in the lower right corner of the representation shows that this map has been scaled down 50,000,000 times. That is, each centimeter on the map represents 50,000,000 real centimeters (1:50,000,000).
As the question asks to convert to kilometers, it is known that each kilometer is equivalent to 100,000 centimeters. Therefore, the scale equivalent to 1:50,000,000 cm is 1 centimeter for every 500 kilometers.
How were covered 72 centimeters of the map:
72 x 500 = 36,000
Final answer: the actual distance traveled by the torch is about 36,000 kilometers.
Question 8 (PUC-RS)
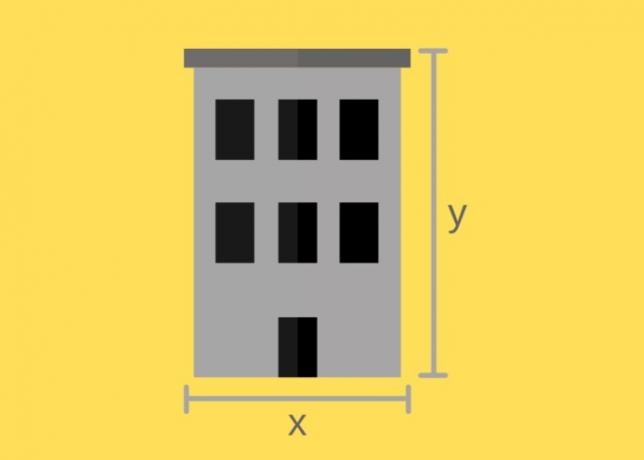
If we took as a basis the design of a building where x measures 12 meters and y measures 24 meters, and we could make a map of its facade reducing it by 60 times, what would be the numerical scale of this representation?
a) 1:60
b) 1:120
c) 1:10
d) 1:60,000
e) 1:100
Correct alternative: a) 1:60.
The denominator of a scale represents the number of times an object or place has been reduced in its representation.
In this way, the height and width of the building become irrelevant, "a map of its facade reducing it by 60 times" is a map where every 1 centimeter represents real 60 centimeters. I.e, it's a scale of one to sixty (1:60).
Question 9 (Enem)
A map is a reduced and simplified representation of a location. This reduction, which is done using a scale, maintains the proportion of the represented space in relation to the real space.
A certain map has a scale of 1:58,000,000.
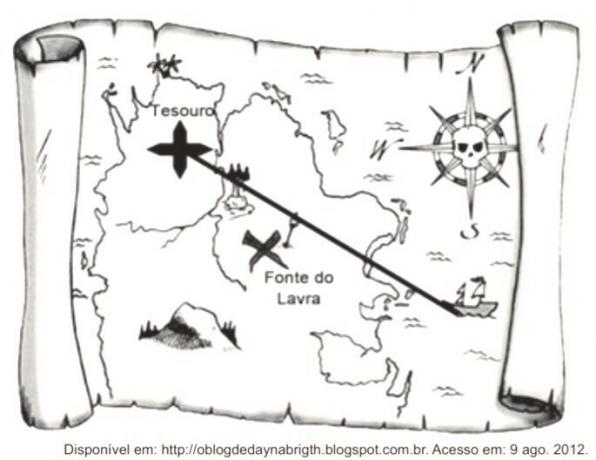
Consider that, on this map, the straight line connecting the ship to the treasure mark measures 7.6 cm.
The actual measurement, in kilometers, of this straight segment is
a) 4 408.
b) 7 632.
c) 44,080.
d) 76 316.
e) 440 800.
Correct alternative: a) 4 408.
According to the statement, the scale of the map is 1:58,000,000 and the distance to be covered in the representation is 7.6 cm.
To convert centimeters to kilometers you have to go five decimal places or, in this case, cut five zeros. Therefore, 58,000,000 cm is equivalent to 580 km.
Thus:
7.6 x 580 = 4408.
Final answer: the real measure of the straight line equals 4,408 kilometers.
Question 10 (UERJ)
In that Empire, the art of cartography reached such perfection that the map of a single province occupied an entire city, and the map of the Empire an entire province. In time, these hulking maps were not enough and the colleges of cartographers built a map of the Empire that was the size of the Empire and coincided with it point by point. Less devoted to the study of cartography, subsequent generations decided that this enlarged map was useless and not without impiety handed it over to the inclemencies of the sun and winters. In the western deserts, the shattered ruins of the map remain, inhabited by animals and beggars.
BORGES, J. L. About rigor in science. In: Universal History of Infamy. Lisbon: Assírio and Alvim, 1982.
In Jorge Luís Borges' short story, a reflection on the functions of cartographic language for geographic knowledge is presented.
Understanding the tale leads to the conclusion that a map of the exact size of the Empire was unnecessary for the following reason:
a) extension of the size of the political territory.
b) imprecise location of administrative regions.
c) precariousness of three-dimensional orientation instruments.
d) equivalence of the proportionality of the spatial representation.
Correct alternative: d) equivalence of the proportionality of the spatial representation.
In the short story by Jorge Luís Borges, the map was understood as perfect for representing exactly each point of the spatial representation in its exact real point.
I.e, the proportion between the real and the representation is equivalent, in a 1:1 scale, which makes the map completely useless.
The usefulness of cartography is precisely to generate knowledge of a place from its representation in reduced dimensions.
Interested? See too:
- What is Cartography?
- Cartographic Projections
- Thematic Maps
- Cartographic scale