Substances are materials that have constant properties (density, melting point, boiling point, etc.). already the mixtures are matters that have variable properties. One way that can be used to identify them is the graphics that represent them.
The graphics of mixtures and substances always have the same composition, that is:
On the x-axis, we have the presence of the variable time;
On the y axis, we have the presence of the variable temperature;
They always have five levels (straight);
The first plateau always refers to the solid physical state;
The second plateau always refers to the melting point, that is, the passage from the solid state to the liquid;
The third plateau always refers to the liquid physical state;
The fourth stage always refers to the melting point, that is, the passage from a liquid to a gaseous state;
The fifth plateau always refers to the physical gaseous state.

Components of a graph about mixtures and substances
We have, in general, four graphics used to represent substances and mixtures, three of which are exclusive to mixtures.
→ Graphic of a substance

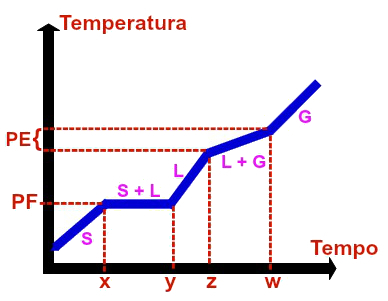
Graphic representation of any substance
The graph of a substance (simple or compound) presents the following parameters:
First, third and fifth levels are always variable, which can be proven by the fact that they are always in the diagonal to the x and y axes (time and temperature), that is, as time passes, so does the temperature increases;
Second plateau (melting point) is constant, which can be proven by analyzing the time span from x to y. In this interval, we have the level always horizontal (constant) in relation to the PF temperature;
Fourth plateau (boiling point) is constant, which can be proven by analyzing the time interval from z to w. In this interval, we have the level always horizontal (constant) in relation to the PE temperature.
→ Graph of a common mix

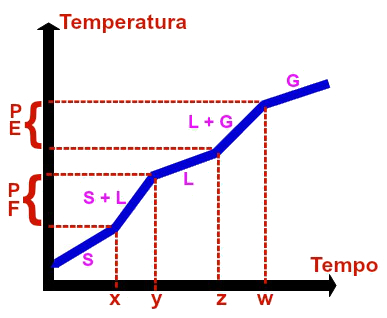
Graphic representation of any common mixture
A common mixture is the union of two or more substances in the same container. A classic example is the mixture between water and salt. The graph of a common mixture always has the following parameters:
Do not stop now... There's more after the advertising ;)
First, second, third, fourth and fifth levels are always variable, which can be proven by the fact that they are always diagonally in relation to the x and y axes (time and temperature), that is, as time passes, so does the temperature increases.
→ Graph of a eutectic mixture

Graphic representation of any eutectic mixture
The eutectic mixture is an exclusively homogeneous mixture formed by solid state materials in very specific amounts. The homogeneous mixture called solder, for example, which is made up of 67% lead and 33% tin, is a eutectic mixture.
The graph of an azeotropic mixture always has the following parameters:
First, third, fourth and fifth levels are always variable, which can be proven by the fact that they are always diagonally to the x and y axes (time and temperature), that is, as time passes, so does the temperature increases.
Second plateau (melting point) is constant, which can be proven by analyzing the time span from x to y. In this interval, we have the level always horizontal (constant) in relation to the PF temperature.
→ Graph of a azeotropic mixture

Graphic representation of any azeotropic mixture
The azeotropic mixture is an exclusively homogeneous mixture and formed by materials in the liquid state in very specific amounts. The homogeneous mixture formed by 95.5% water and 4.5% ethanol, for example, is an azeotropic mixture.
The graph of an azeotropic mixture always has the following parameters:
First, second, third and fifth levels are always variable, which can be proven by the fact that they are always diagonally in relation to the x and y axes (time and temperature), that is, as time passes, the temperature also increases;
Fourth plateau (boiling point) is constant, which can be proven by analyzing the time interval from z to w. In this interval, we have the level always horizontal (constant) in relation to the PE temperature.
By Me. Diogo Lopes Dias
Would you like to reference this text in a school or academic work? Look:
DAYS, Diogo Lopes. "Graphs of mixtures and substances"; Brazil School. Available in: https://brasilescola.uol.com.br/quimica/graficos-misturas-substancias.htm. Accessed on June 28, 2021.


