THE geometric mean along with the arithmetic mean and the harmonic mean were developed by the Pythagorean school. At statistic it is quite common to search for representation of a dataset by a single value for decision making. One of the possibilities for the central value is the geometric mean.
It is useful for representing a set that has data that behaves close to a geometric progression, also to find the side of square and cube, knowing the area and volume respectively. The geometric mean is also applied in situations of accumulation of percentage increase or decrease. To calculate the geometric mean of a set of n values, we calculate the nth root of the product of the elements, that is, if a set has three terms, for example, we multiply the three and calculate the cubic root of the product.

Geometric mean formula
The geometric mean is used to find a average value between a set of data. To calculate the geometric mean, a set with two or more elements is required. Let A be a data set A = (x
1, x2, x3,... xno), a set with n elements, the geometric mean of this set is calculated by:
Read too: Dispersion measures: amplitude and deviation
Calculation of geometric mean
Let A = {3,12,16,36}, what will be the geometric mean of this set?
Resolution:
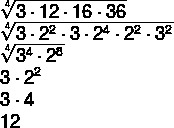
To calculate the geometric mean, we first count the number of terms in the set, in the case n = 4. So we have to:
Method 1: Performing the multiplications.

As we do not always have a calculator available to perform the multiplications, it is possible to make the calculation based on the factorization of a natural number.
Method 2: Factorization.
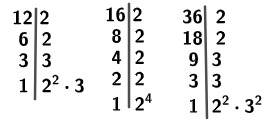
Using the factorizations we have to:
Applications of geometric mean
The geometric mean can be applied to any statistical dataset, but typically it is employed in geometry, to compare sides of prisms and cubes of the same volume, or squares and rectangles of the same area. There is also application in financial math problems that involve an accumulated percentage rate, that is, percentage under percentage. Besides being the most convenient mean for data that behaves like a geometric progression.
Do not stop now... There's more after the advertising ;)
Example 1: Application in percentage.
A product, for three months, had consecutive increases, the first was 20%, the second 10% and the third 25%. What was the average percentage increase at the end of this period?
Resolution
The product initially cost 100%, in the first month it started to cost 120%, which, in its decimal form, is written as 1.2. This reasoning will be the same for the three increases, so we want the geometric mean between: 1.2; 1,1; and 1.25.

The increase is 18.2% per month on average.
See too: Percentage calculation with rule of three
Example 2: Application in geometry.
What should be the value of x in the image, knowing that the square and the rectangle then have the same area?

Resolution:
To find the x value of the square's side, we will calculate the geometric mean between the sides of the rectangle.

Therefore, the side of the square is 12 cm.
Example 3: Geometric progression.
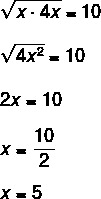
What are the terms of P.G., knowing that the predecessor of the central value is x, the central value is 10 and the successor of the central value is 4x.
Resolution:
We know the terms of P.G. (x, 10.4x) and we know that the geometric mean between the successor and the predecessor is equal to the central term of the P.G., so we have to:
Difference between geometric mean and arithmetic mean
In statistics, the way the data behaves is very important for choosing a single value to represent it. That's why there are types of central measures and there are types of media.
The choice of which average to use must be made taking into account the data set we are working on. As seen in the example, if it is data that behaves close to a geometric progression and has the most exponential growth, the geometric mean is recommended.
In other situations, mostly we use the arithmetic average, for example, the average weight of an individual over the course of the year. When comparing the calculation of two types of mean for the same data set, the geometric will always be smaller than the arithmetic.
When we compare the arithmetic mean formula with the geometric mean formula, we notice the difference, as the former is calculated by sum of terms dividedThe by the amount of terms, while the second, as we have seen, is calculated by the nth root of the product of all terms.

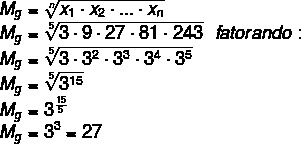
Example 4: Given the set (3, 9, 27, 81, 243), realize that it is a P.G. of ratio 3, since from the first to the second term we multiply by three, from the second to the third as well, and so on. When looking for a central value to represent this set, ideally it should be the central term of the progression, which happens if we calculate the geometric mean. However, when calculating the arithmetic mean, larger values make the value of this mean too high in relation to the terms of the set, and the larger the value, the further away from a representation of the central term the arithmetic mean will be.
Resolution:
1st arithmetic mean

2nd geometric mean
Also access: Fashion, average and mediana – centrality measures
solved exercises
Question 1 - The price of gasoline in Brazil has gone through large increases in recent months. The monthly increases in the last 4 months were, respectively, 9%, 15%, 25% and 16%. What was the average percentage increase in this period?
a) 15%
b) 15.5%
c) 16%
d) 14%
e) 14.5%
Resolution

Alternative A
Question 2 - A prism with a rectangular base has the same volume as a cube. Knowing that the dimensions of the prism are 6 cm long, 20 cm high and 25 cm wide, what is the value of the side of the cube in centimeters?

Resolution:

Alternative D
By Raul Rodrigues de Oliveira
Maths teacher

