Statistical studies are responsible for analyzing information through informative tables and graphical representations, in order to provide clarity in the results obtained. The collected data are organized in tables that detail the absolute and relative frequencies. In some situations, the amount of different information makes it impossible to build a table with one line for each value representation. In these cases, we choose to group the data into class ranges.
For the best representation of this situation we will present a group of people whose heights were collected. Watch:
1. Amorim: 1.91
2. Antonio: 1.78
3. Bernardo: 1.69
4. Carlos: 1.82
5. Celsus: 1.80
6. Danilo: 1.72
7. Douglas: 1.73
8. Daniel: 1.76
9. Everton: 1.77
10. Gabriel: 1.94
11. Gustavo: 1.84
12. Hector: 1.87
13. Italo: 1.85
14. João Carlos: 1.89
15. João Vinicius: 1.70
16. Leonardo: 1.91
17. Lucas: 1.86
18. Marlon: 1.70
19. Orlando: 1.71
20. Peter: 1.94
To define the intervals, let's perform the subtraction between the largest and smallest height: 1.94 – 1.69 = 0.25.
The number of intervals must always be greater than four. In the case described, let's stipulate five class ranges, so we divide the total height range by 5:
Do not stop now... There's more after the advertising ;)
0,25: 5 = 0,05. See the ranges:
1,69  1,74(1,69 + 0,05)
1,74 1,79(1,74 + 0,05)
1,79 1,84(1,79 + 0,05)
1,84 1,89(1,84 + 0,05)
1,89 1,94(1,89 + 0,05)
Important: in the 1.69 range 1.74, the symbol indicates closed on the left and open on the right, so heights equal to 1.69; 1,70; 1,71; 1.72 and 1.73 will be recorded, and height 1.74 will only be computed in the 1.74 range 1.79 and so on. Look at the table with the data distributed according to their range:
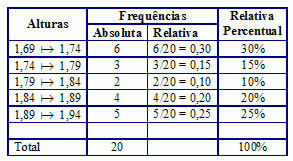
The table informs the heights according to the intervals, the absolute frequency and the relative frequency and percentage.
by Mark Noah
Graduated in Mathematics
Brazil School Team