Median is the central number of a list of data arranged in ascending or descending order, being a measure of central tendency or centrality.
The median is the value of the middle or, which represents the middle, of a list of data. For median, the position of the values is important, as is the organization of the data.
The measures of central tendency or centrality in statistics have the function of characterizing a set of quantitative data, informing its mean value or central position. These values act as a summary that informs an overall average characteristic of the data.
The organized list of data is called ROL, which is needed to determine the Median. Other important measures of centrality are the averages and the mode, widely used in statistic.
How to calculate the Median
To calculate the median, the data are organized in an ascending or descending way. This list is the ROL of data. Afterwards, we check if the amount of data in the ROL is even or odd.
If the amount of data in the ROL is odd, the median is the middle value of the center position.
If the amount of data in the ROL is even, the median is the arithmetic average of core values.
Example 1 — median with ODD amount of data in ROL.
Find the median of the set A={12, 4, 7, 23, 38}.
First we organize the ROL.
A={4, 7, 12, 23, 38}
We verified that the quantity of elements in the set A is ODD, being the median the value of the middle.
Therefore, the median of set A is 12.
Example 2 — median with PAR amount of data in the ROL.
What is the median height of players on a volleyball team where heights are: 2.05m; 1.97m; 1.87m; 1.99m; 2.01m; 1.83m?
Organizing the ROL:
1.83m; 1.87m; 1.97m; 1.99m; 2.01m; 2.05m
We verify that the amount of data is PAR. The median is the arithmetic mean of the core values.
Therefore, the median height of the players is 1.98m.
Median Exercises
Exercise 1
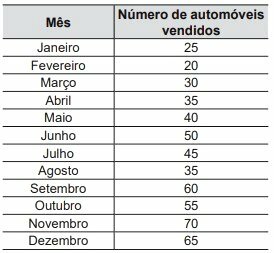
(Enem 2021) The manager of a concessionaire presented the following table at a meeting of directors. It is known that at the end of the meeting, in order to prepare goals and plans for the next year, the administrator will evaluate sales based on the median number of cars sold in the period from January to December.

What was the median of the data presented?
a) 40.0
b) 42.5
c) 45.0
d) 47.5
e) 50.0
Correct answer: b) 42.5
We organize the data increasingly:
20, 25, 30, 35, 35, 40, 45, 50, 55, 60, 65, 70
The number of elements is even, so we average the central values: 40 and 45.
Exercise 2
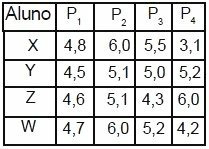
(CEDERJ 2016) The table below shows the scores on four tests P1, P2, P3 and P4, of four students named X, Y, Z and W.

The smallest median of the four tests is for the student
a) X
b) Y
c) Z
d) W
Correct answer: c) Z
We must calculate the median for each student. As there are four tests, an even number, the median is the arithmetic mean between the central values.
Student X
ROL: 3.1; 4,8; 5,5; 6,0
Student Y
ROL: 4.5; 5,0; 5,1; 5,2
Student Z
ROL: 4.3; 4,6; 5,1; 6,0
Student W
ROL: 4.2; 4,7; 5,2; 6,0
Therefore, the student with the smallest median is student Z.
Exercise 3
The following frequency distribution refers to a survey carried out by a factory regarding the number of pants that its workers wear for the purpose of making uniforms.
| pants numbering | Frequency (Number of workers) |
| 42 | 9 |
| 44 | 16 |
| 46 | 10 |
| 48 | 5 |
| 50 | 5 |
On the above, check what is correct.
The median of pants numbers is 44.
Right
Wrong
Correct answer: right.
The question asks for the median of the numbers that are in ascending order.
Adding the number of workers, we have: 9 + 16 + 10 + 5 + 5 = 45. The middle number is 23.
In order, 9 employees use 42. Afterwards, the next 16 employees use 44.
9 + 16 = 25
Therefore, the 23rd is in the 44 numbering band.
Read too:
- Average, Fashion and Median
- Average, Fashion and Median exercises
For more about statistics:
- Statistics - Exercises
- Arithmetic Average Exercises
- Weighted Arithmetic Average
- Geometric Mean
- Dispersion Measures
- Standard deviation
- Variance and standard deviation
- Relative Frequency


