In the study of Statistic, we have some strategies to check whether the values presented in a dataset are dispersed or not and how far apart they may be. The tools used to make this possible are classified as dispersion measures and called variance and standard deviation. Let's see what each of them represents:
Variance:
Given a set of data, variance is a measure of dispersion that shows how far each value in that set is from the central (average) value.
The smaller the variance, the closer the values are to the mean; but the larger it is, the farther the values are from the mean.
-
Consider that x1, x2, …, xnothey are the no elements of a sample is that X and the arithmetic mean of these elements. The calculation of sample variance It is given by:
Var. sample = (x1 – x)² + (x2 – x)² + (x3 – x)² +... + (xno – x)²
n - 1 -
If, on the other hand, we want to calculate the population variance, we will consider all elements of the population, not just a sample. In this case, the calculation has a small difference. Watch:
Var. population = (x1 – x)² + (x2 – x)² + (x3 – x)² +... + (xno – x)²
no
Standard deviation:
The standard deviation is able to identify the “error” in a data set, if we wanted to replace one of the collected values by the arithmetic mean.
-
The standard deviation appears next to the arithmetic mean, informing how “reliable” this value is. It is presented as follows:
arithmetic average (x) ± standard deviation (sd)
-
The calculation of the standard deviation is made from the positive square root of the variance. Therefore:
dp = √var
Let's now apply the variance and standard deviation calculation in an example:
In one school, the board decided to look at the number of students who have all grades above average in all subjects. To better analyze it, director Ana decided to assemble a table with the amount of “blue” grades in a sample of four classes over a year. See below the table organized by the principal:
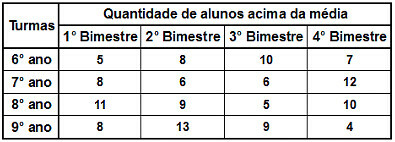
Before calculating the variance, it is necessary to check the arithmetic average(x) the number of above-average students in each class:
6th year → x = 5 + 8 + 10 + 7 = 30 = 7,50.
4 4
7th year → x = 8 + 6 + 6 + 12 = 32 = 8,00.
4 4
8th year → x = 11 + 9 + 5 + 10 = 35 = 8,75.
4 4
9th year → x = 8 + 13 + 9 + 4 = 34 = 8,50.
4 4
To calculate the variance of the number of students above the average in each class, we use a sample, that's why we use the formula of sample variance:
Var. sample = (x1 – x)² + (x2 – x)² + (x3 – x)² +... + (xno – x)²
n - 1
6th year → Var = (5 – 7,50)² + (8 – 7,50)² + (10 – 7,50)² + (7 – 7,50)²
4 – 1
Var = (– 2,50)² + (0,50)² + (2,50)² + (– 0,50)²
3
Var = 6,25 + 0,25 + 6,25 + 0,25
3
Var = 13,00
3
Var = 4.33
7th year → Var = (8 – 8,00)² + (6 – 8,00)² + (6 – 8,00)² + (12 – 8,00)²
4 – 1
Var = (0,00)² + (– 2,00)² + (– 2,00)² + (4,00)²
3
Var = 0,00 + 4,00 + 4,00 + 16,00
3
Var = 24,00
3
Var = 8.00
8th year → Var = (11 – 8,75)² + (9 – 8,75)² + (5 – 8,75)² + (10 – 8,75)²
4 – 1
Var = (2,25)² + (0,25)² + (– 3,75)² + (1,25)²
3
Var = 5,06 + 0,06 + 14,06 + 1,56
3
Var = 20,74
3
Var = 6.91
9th year → Var = (8 – 8,50)² + (13 – 8,50)² + (9 – 8,50)² + (4 – 8,50)²
4 – 1
Var = (– 0,50)² + (4,50)² + (0,50)² + (– 4,50)²
3
Var = 0,25 + 20,25 + 0,25 + 20,25
3
Var = 41,00
3
Var = 13.66
Once the variance of each class is known, let's now calculate the standard deviation:
|
6th year dp = √var |
7th year dp = √var |
8th year dp = √var |
9th year dp = √var |
To conclude her analysis, the principal can present the following values that indicate the average number of students above the average per class surveyed:
6th year: 7.50 ± 2.08 students above average per term;
7th year: 8.00 ± 2.83 students above the average per two months;
8th year: 8.75 ± 2.63 students above the average per two months;
9th year: 8.50 ± 3.70 students above the average per two months;
Another measure of dispersion is the coefficient of variation. Look on here how to calculate it!
By Amanda Gonçalves
Graduated in Mathematics
Source: Brazil School - https://brasilescola.uol.com.br/matematica/medidas-dispersao-variancia-desvio-padrao.htm