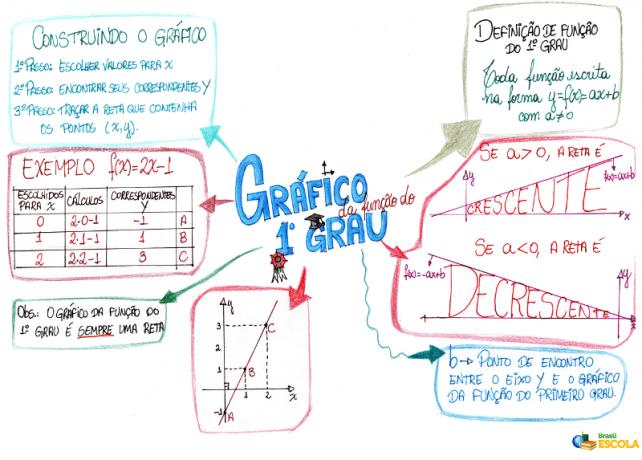
Every function can be graphed, and the 1st degree function is formed by a straight line. This line can be increasing or decreasing, depending on the sign of The.
When a > 0
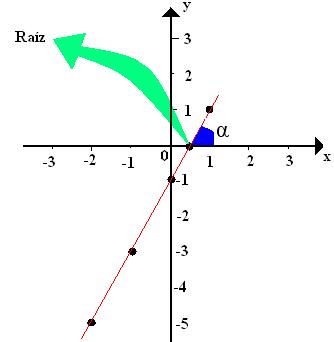
That means the company will be positive. For example, given the function: f (x) = 2x – 1 or
y = 2x - 1, where a = 2 and b = -1. To build your graph we must assign real values to x so that we can find the corresponding values in y
| x | y |
| - 2 | - 5 |
| - 1 | - 3 |
| 0 | - 1 |
| 1/2 | 0 |
| 1 | 1 |
We can observe that as the value of x increases the value of y also increases, so we say that when a > 0 the function is increasing.
Mind Map: 1st Degree Function Chart
*To download the mind map in PDF, Click here!
With the values of x and y we form the coordinates, which are ordered pairs that we place in the Cartesian plane to form the line. Look:
On the vertical axis we put the y values and on the horizontal axis we put the x values.
When < 0
This indicates that a will be negative. For example, given the function f (x) = - x + 1 or
y = - x + 1, where a = -1 and b = 1. To build your graph we must assign real values to x so that we can find the corresponding values in y.
Do not stop now... There's more after the advertising ;)
x and y
-2 3
-1 2
0 1
1 0
We can observe that as the value of x increases the value of y decreases, so we say that when a < 0 the function is decreasing.
With the values of x and y we form the coordinates that are ordered pairs that we put in the Cartesian plane to form the line. Look:
On the vertical axis we put the y values and on the horizontal axis we put the x values.

Characteristics of a graph of a 1st degree function
• With a > 0 the graph will be increasing.
• With < 0 the graph will be decreasing.
• The angle α formed with the line and the x axis will be acute (less than 90°) when a > 0.
• The angle α formed with a straight line and with the x axis will be obtuse (greater than 90º) when a < 0.
• When constructing a graph of a 1st degree function, just indicate two values for x, as the graph is a line and a line is formed by at least 2 points.
• Only one point cuts the x-axis, and that point is the root of the function.
• Only one point cuts the y axis, that point is the value of b.
by Danielle de Miranda
Graduated in Mathematics
*Mental Map by Luiz Paulo Silva
Graduated in Mathematics
Would you like to reference this text in a school or academic work? Look:
RAMOS, Danielle de Miranda. "1st Grade Function Chart"; Brazil School. Available in: https://brasilescola.uol.com.br/matematica/grafico-funcao-1-grau.htm. Accessed on June 27, 2021.