THE cartographic scale it is an important element present in maps, being used to represent the relation of proportion between the real area and its representation. It is the scale that indicates how much a certain geographic space was reduced to “fit” in the place where it was made in the form of graphic material.
We know that maps are reduced reproductions of a certain area. But this reduction does not occur randomly, but proportionally, that is, safeguarding a relationship between the original measures and their representations. The numerical expression of this proportion is the scale.
For example, if the scale of a given map is 1:500, it means that each centimeter of the map represents 500 centimeters of real space. Consequently, this ratio is 1 per 500.
There are, therefore, two types of scale, that is, two different ways of representing it: a numerical scale and the graphic scale. The numeric, as its name suggests, is basically used by numbers; the graphics, on the other hand, uses a schematization.
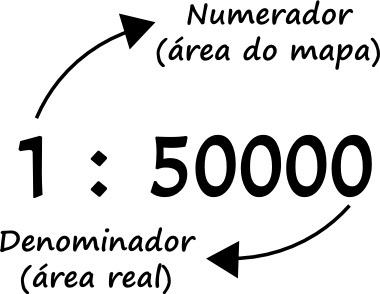
The numerical scale represents, in the form of a fraction, the proportion of the scale, having, in this way, its numerator and its denominator. Check out:

Example of numerical scale and its terms
In the diagram above, we can see that the numerator represents the map area and the denominator the real area. It is generally convenient to leave the numerator always at 1, so that we know how much each unit of the map is equivalent. When it does not have the indicated measure (cm, m, km) in its notation, it means, by convention, that it is in centimeters. Otherwise, this unit of measure needs to be noted.
The graphic scale directly represents the relational space and its measures.

Graphic scale examples
In the diagrams above, we can see that each interval between one number and another represents a specific distance, which is duly pointed out by the scale. This type of scale has the merit of zooming in and out along with the map. So if I transfer a map that was on smaller paper to a large poster, the scale will still be correct, which would not be the case with the numerical scale, which in this case would have to be recalculated.
Large scale, small scale... What is the difference?
Imagine that every map is an aerial view of a given space. Thus, to know if a scale is large or small, or if it is larger than another, it is enough to understand that the scale is nothing more than the approximation level of the aerial view of the map. Another way is to look at the numerical scale, remembering that it is a division. Thus, the smaller this denominator, the larger the scale.
Example. Consider these two scales: a) 1:5000; b) 1:10000. The first scale is a division of 1 to five thousand which, when calculated, will surely give a greater number than a division of 1 to ten thousand. Therefore, the first scale is larger than the second.
Thus, it is possible to see that the larger the scale, the smaller the area represented on the map and vice versa, because the larger the scale, the closer the aerial view of the represented location is. This, in turn, allows us a greater level of detail in the information, as the closer we are to a location, the more details we can see.
In short, the sentence is:
The larger the scale, the smaller the area represented and the greater the level of detail.
A world map has a very small scale, with a large area represented and, of course, will present less detail than, for example, a map of the state of Bahia, which would have, in this case, a large scale.
scale calculation
To calculate the scale, just remember its concept: Scale (E) is the ratio (division) between the map area (d) by the real area (D). Thus:
E = d
D
So, to calculate a scale of a map where two points are 5 cm apart from each other, and in the real world they are 1000 cm apart, just apply the formula:
E = 5/1000 → E = 1/200
The scale, in this case, is 1:200 or one to two hundred.
By Rodolfo Alves Pena
Graduated in Geography
