graphics are visual representations of data and numerical information that serve to facilitate the interpretation of these.
The information present in the graphics refers to everything that can be measured or quantified, usually showing a parallel between qualities and quantities. The figure in the graph helps make its content more logical, making it possible for the person analyzing it to assign meaning to the content of the data in a more concrete way.
For this reason, graphics must be constructed with simplicity and clarity, precisely so that they can be self-explanatory and easy to understand.
One of the most common functions of graphics is to establish a statistical dimension on a particular subject or fact. For example, a graph that helps to understand the mortality rate in Brazil.
Types of graphics
Currently, it is essential to know how to interpret the different types of graphs, either for the performance of a certain function, or to be able to absorb useful information in everyday life.
Column chart
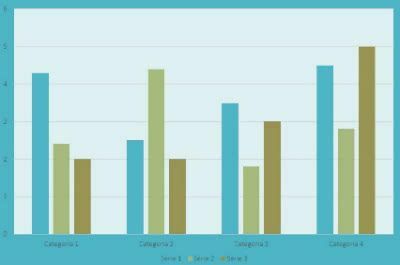
One of the most used graphics. It is used to compare quantities, showing variations that show the intensity of a given phenomenon, compared to a period of time, for example.
bar chart
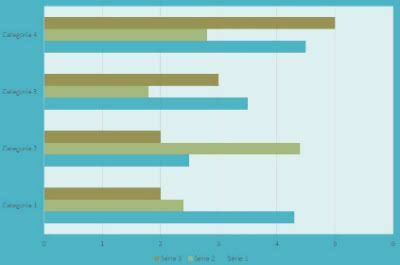
It is similar to a column chart, but with the data values arranged horizontally, while comparative information appears vertically.
pie chart
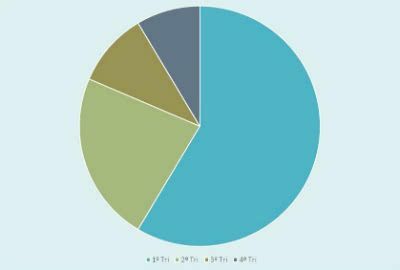
Also called Sector Chart, this model is named for having the shape of a pie (a circle). Used to gather values from a whole, following the concept of proportionality.
Area chart
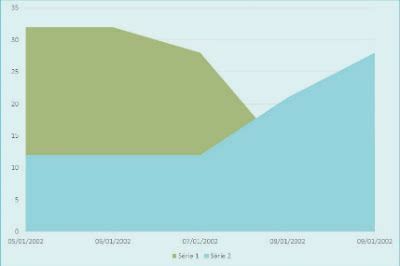
It is often common to compare values or show changes in data over a period of time. Formed by lines and points, and the area must be filled.
Line chart
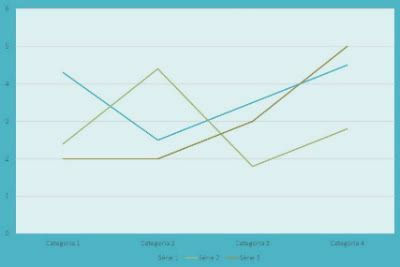
Also called a Segment Graph, it serves to present (numerical) values in a given space-time. Shows the evolutions and decreases of a given phenomenon.
Histogram
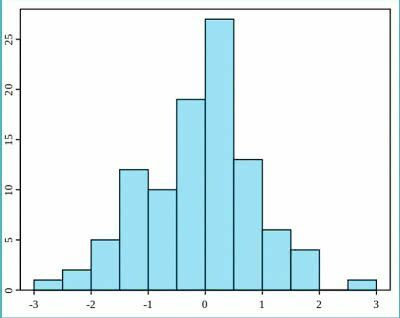
The difference between the histogram and the column chart is that the first one has no space between the vertical bars.
Learn more about histogram.
Infographic
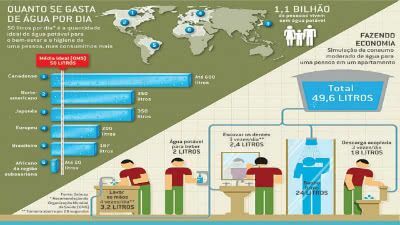
It consists of the union between a graphic (image) and explanatory texts. They are very common in newspaper and magazine reports, for example.
Learn more about meaning of an infographic and visual communication.

