In cartography, the contour lines are representations of relief produced through the use of imaginary lines (called linesaltimetric, when on the surface, and linesbathymetric, when below sea level). They have the merit of representing the unevenness and topographic slope on a flat surface.
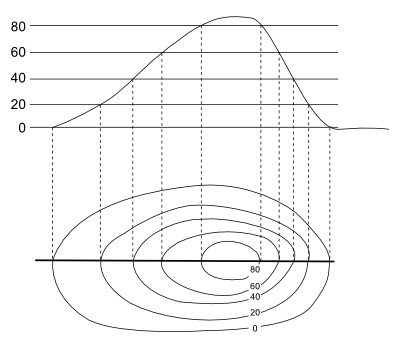
The use of the contour curve technique is recommended in areas with large scale, that is, in small areas, where the level of detail is usually greater. Thus, we can have the area of a slope being represented by separating the altitudes in an orderly way, so that each altitude represents a line on the map, observe:

Representation of a topographic profile in contour lines
Note on the map above that the farther the contour lines are, the lower the slope, that is, the less steep the terrain. On the contrary, the closer the curves, the greater the slope of the site.
Another necessary consideration is the fact that all points located on the same line have an equal altitude, which is one of the greatest importance of this technique of cartographic representation. The value of this altitude is always taken in relation to sea level and is represented by the numbers described just above the curve, usually in meters.
Do not stop now... There's more after the advertising ;)
Contour lines tend to be parallel to each other and rarely intersect, which only occurs when there is some kind of accident unusual geographic location, such as a ravine, that is, when they touch, it is because a certain altitude is on the other.
In addition to these properties, it is possible to notice that the contour lines never bifurcate. See another example:

Example of a larger area represented in contour lines
Producing contour topographic maps, especially of slightly larger areas, requires a lot of work in data collection, such as altitudes, involving rigorous mathematical precision. However, with technological advances in the field of cartography, both with aerophotogrammetry and with satellite projections, many Sometimes this type of map is produced almost automatically, which facilitates geological and geomorphological studies on the surface terrestrial.
By Rodolfo Alves Pena
Graduated in Geography
Would you like to reference this text in a school or academic work? Look:
PENA, Rodolfo F. Alves. "Level Curves"; Brazil School. Available in: https://brasilescola.uol.com.br/geografia/curvas-nivel.htm. Accessed on June 28, 2021.


