As explained in the text Solutions Saturation, chemical solutions are formed by the dissolution of a solute on a solvent. Each solute has a solubility coefficient specific, which is the maximum amount of solute dissolvable in a given amount of solvent at a given temperature.
Construction of a graph with solubility curve
For example, the solubility coefficient of the KNO3 is 31.2 g in 100 g of water at 20°C. If we dissolve exactly that amount of potassium nitrate in 100 g of water at 20°C, a saturated solution. Any additional amount of this salt will precipitate out (forms a bottom body in the container).
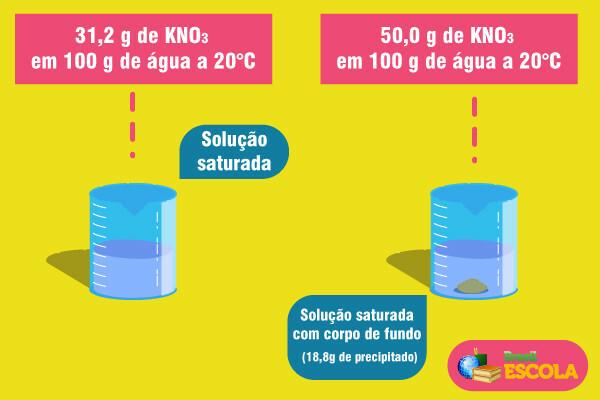
However, the solubility coefficient varies with temperature. So, if we heat this saturated solution with KNO bottom body3, the precipitate will gradually dissolve in the water. See below the values of the KNO solubility coefficients3 in 100 g of water at different temperatures:
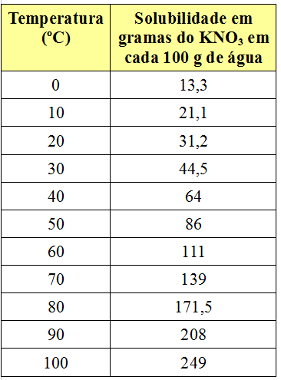
Note that the solubility of this salt in water increases with increasing temperature. In most substances, this is also the case. If we put these values in a
graphic, we will have the following: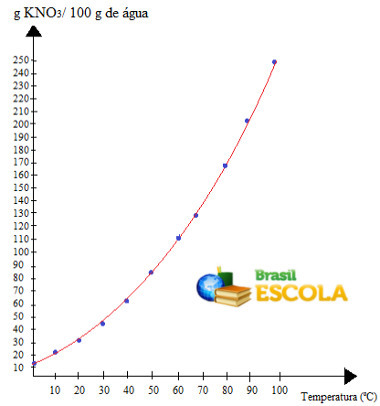
this is the call solubility curve of the KNO3. We say it is ascending because it grows with increasing temperature.
Characteristics of solubility curves of solutes in a graph
Each substance has its solubility curve for a given solvent. Some of these substances have reduced solubility with increasing temperature, as is the case of CaCrO4, that have solubility curve downward. This means that if we heat a saturated solution of that salt, some of the dissolved salt will precipitate out.
As for other substances, the increase in temperature does not interfere so much in solubility, as occurs with a solution of table salt (NaCl). At 20°C, the solubility coefficient of NaCl is 36 g in 100 g of water, but if we increase the temperature to 100°C, this solubility will only increase to 39.8 g, a very small increase.
There are also substances in which the solubility only increases up to a certain point of the temperature increase, because after that the solubility decreases. This happens, for example, with hydrated substances, which, when heated, reach a time when they dehydrate. Therefore, as its composition changes, its solubility variation with temperature also changes. This occurrence can be observed in the graph through inflections in the solubility curve.
Below, we present a graph with solubility curves of various substances:
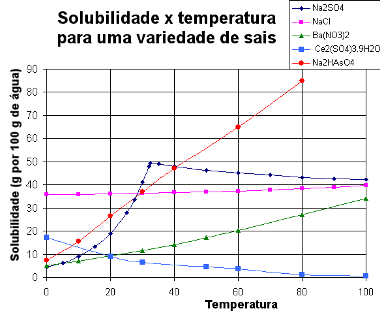
Solubility Curves of Various Salts
Through this type of graph, we can compare the solubilities of different salts in the same solvent and at the same temperatures.
Classification of a solution using a graph with a solubility curve
At solubility curves they also help determine the saturation of solutions, that is, whether they are unsaturated, saturated, background saturated, or supersaturated. See an example:
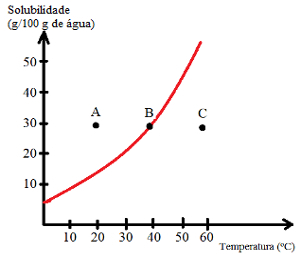
See what types of solutions are indicated by points A, B and C:
A: Saturated with bottom body. At point A, 30 g of solute is dissolved in 100 g of water at 20°C. The curve shows that at this point the solubility coefficient is about 15 g/100 g of water. Thus, as the amount of solute present is greater, a saturated solution with a bottom body is obtained.
B: Saturated. Point B is located exactly on the solubility curve, which indicates that the solution is saturated, as there is 30 g of solute dissolved in 100 g of water at 40°C. This, then, is exactly the solubility coefficient of this solute at this temperature.
C: Unsaturated. There are 30 g of solute dissolved in 100 g of water at 60°C. The curve shows that at this point the solubility coefficient is greater than 50 g/100 g of water. Thus, as the amount of solute dissolved is less than the solubility coefficient, there is an unsaturated solution.
Thus, we can conclude that:
Points above the curve: saturated solutions with background body;
Points on the curve: saturated solutions;
Points under the curve: unsaturated solutions.
By Jennifer Fogaça
Graduated in Chemistry
Source: Brazil School - https://brasilescola.uol.com.br/quimica/graficos-das-curvas-solubilidade.htm