In an isothermal transformation, the volume and pressure variation of a certain gas, but the constant temperature; hence the origin of the isothermal name (Greek: iso = equal; thermo = heat).
Scientists Boyle and Mariotte, in isolation, carried out similar experiments and the result obtained was: as the pressure increases, the volume of the gas decreases.
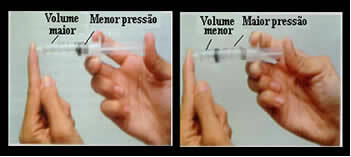
Just think, for example, of the plunger of a syringe. If we apply external pressure on this plunger, that is, if we increase the pressure, the volume of air occupied inside the syringe will decrease, and vice versa.

Volume and pressure are inversely proportional: in the left panel, the pressure is small and the volume occupied by air is large. On the right, when more pressure is applied to the syringe plunger, the volume decreases.
This is not an isolated case, it is something that is repeated with common regularity for gases. Therefore, this fact was stated in the form of a law, which can be described as follows:
| boyle's law or Boyle-Mariotte's Law: Under constant temperature, the volume occupied by a fixed mass of a gas is inversely proportional to its pressure. |
This means that if we double the pressure of a gas, its volume will halve and so on. When two such quantities are inversely proportional, their product is a constant; thus, mathematically, this relationship can be represented as follows:
| P.V = k |
Where k = constant.
Thus, if in a first situation we have the pressure value of a certain gas as P1 and its respective volume as V1, then we have to:
| P1. V1 = k |
If we increase this pressure to P2, its volume will also be changed to V2 and again we will have to:
| P2 . V2 = k |
Thus, we reach the conclusion:
| P1. V1 =P2. V2 |
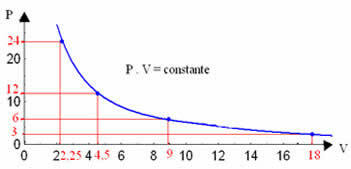
This constancy can be seen by the example given in the table below, of the pressures and volumes of a gas with a fixed mass:

By graphing these values, we will see the formation of a curve.

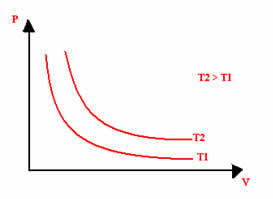
The graphical representation of an isothermal transformation will always be a hyperbola, regardless of the values of pressure and volume and temperature at which the experiment was carried out. This hyperbola is called isotherm; so, as can be seen in the graph below, different temperatures give rise to different isotherms.

Source: Brazil School - https://brasilescola.uol.com.br/quimica/transformacao-isotermica-ou-lei-boyle.htm
