Cladograms are graphical representations that illustrate evolutionary relationships between different groups of organisms. They contribute for understanding phylogeny, highlighting the evolutionary history shared between different species.
These diagrams are constructed based on shared and derived characteristics, known as synapomorphies. A cladogram is made up of terminals, branches, nodes and root. Each bifurcation in a cladogram represents a point at which a common ancestral lineage split into distinct lineages.
Read too: Genetic variability — fundamental element for evolution to occur
Topics in this article
- 1 - Summary of cladograms
- 2 - What is a cladogram?
- 3 - Are phylogeny and cladogram synonymous?
- 4 - What is the function of the cladogram?
- 5 - What are the elements of the cladogram?
- 6 - How to construct a cladogram?
- 7 - How do you read a cladogram?
Summary about cladograms
- Cladograms are branching diagrams that represent the phylogenetic relationships between taxa.
- They were proposed within the phylogenetic or cladistic systematics.
- Phylogeny and cladogram are not synonymous.
- Cladograms are constructed based on synapomorphies, defined through hypotheses of homologies between characteristics of different organisms.
- Parsimony is an important criterion in the construction of cladograms and seeks the simplest pattern that explains the observed relationships.
- The elements of a cladogram are: terminals, nodes, branches and root.
- The arrangement of organisms in the branches of the cladogram reflects the proximity of their evolutionary relationships.
- Each node in a cladogram represents a common ancestor.
- Fossils are not considered us. They are terminal.
- The length of the branches of a cladogram does not represent the passage of time.
- These representations help to understand biological diversity and how different organisms are evolutionarily related.
What is a cladogram?
Cladograms are branching diagrams representing phylogenetic kinship relationships between taxa (group of organisms brought together based on shared characteristics). Cladograms are part of phylogenetic or cladistic systematics, an approach to systematics proposed based on the publication of the works of Willi Hennig in 1966.
In cladistics, it is understood that the diversity of living beings it results from evolutionary processes, such as anagenesis and cladogenesis. Anagenesis is the process by which a character emerges or changes in a population over time, being responsible for evolutionary novelties.
Cladogenesis refers to the evolutionary changes of phylogenetic lineages related to speciation events (emergence of two or more descendant species from an ancestral species), leading to the evolutionary diversification of a lineage.
Do not stop now... There's more after the advertising ;)
Cladistics only proposes the recognition of monophyletic groups (a group formed exclusively by an ancestral species and all its descendants) as natural, forming their taxon groupings based on the recognition of synapomorphies (derived characters shared between terminal taxa that compose).
It also uses parsimony as a criterion in choosing between hypotheses that explain the phylogenetic kinship relationships between organisms. According to the parsimony criterion, the simplest explanation of the phylogenetic relationship between organisms is the one that presupposes the smallest number of evolutionary steps, that is, minimizing changes in the state of characters throughout evolution.
See too: What are analogous organs and homologous organs?
Are phylogeny and cladogram synonymous?
It is important to highlight that It is not recommended to use the terms phylogeny and cladogram as synonyms. Phylogeny represents the evolutionary relationships between taxa, including aspects of the process of evolutionary diversification of a biological lineage through cladogenesis events, not represented in cladograms. Time, for example, is not represented in these diagrams.
What is the function of the cladogram?
Cladograms offer a visual representation of the evolutionary relationships between diverse groups of organisms, providing a structure that facilitates the organization and understanding of knowledge about evolution. These diagrams not only simplify the analysis and communication of complex data but also allow the identification of characteristics shared between different groups by including them in the branches of the cladogram.
Cladograms also highlight clades, which represent groups of organisms united by a common ancestor, contributing to the delimitation of taxa at various hierarchical levels, as a species, gender, family and order. This visual approach is essential for understanding biological diversity and the evolutionary interconnections between living beings.
What are the elements of the cladogram?
The cladogram is composed of:
- terminals;
- branches;
- us;
- source.
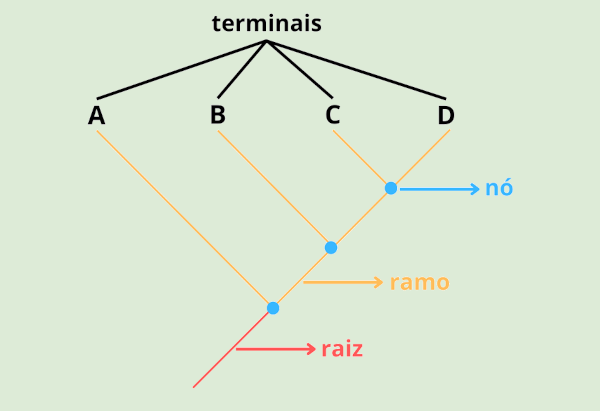
The terminals represent the study entities, which can be an individual, populations or species. The lines leaving the terminals are the branches. The branches are connected to each other by a knot. They directly connect terminals as well as levels further down.
The node represents the hypothetical ancestor for each cluster in which the cladogenesis event occurred. The last node designates the insertion of the root, the point at which a cladogram connects to the rest of the tree of life, and represents a hypothesis of the oldest lineage of the group.
Important: Nodes do not represent fossils. A fossil, when found, is a known element in the analysis and will be represented by a terminal using a convention (usually a dagger) to highlight that it is a fossil taxon.
How to build a cladogram?
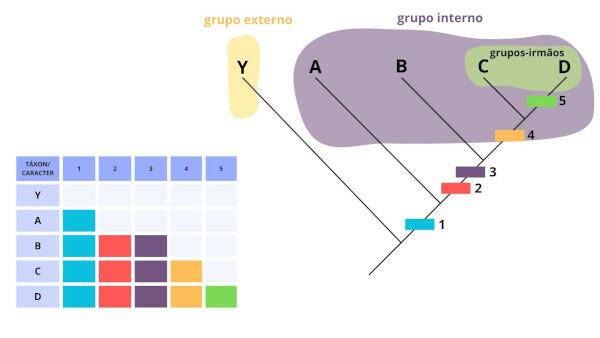
Cladograms are constructed based on the definition of terminals, which represent the set of taxa of interest to be studied and constitute the internal group. The set of species to be included for comparative purposes with the taxa belonging to the internal group constitutes the external group. The external group also has the function of assisting at the tree's rooting point during an analysis.
For the phylogenetic reconstruction of a set of organisms, data from morphological studies are used, genetic, behavioral, ecological, embryological or any inheritable characteristics.
Systematists (systematics researchers) analyze a large number of specimens representing different lineages of interest, looking for characteristics (or characters) present in these organisms. In this search, hypotheses of homology are outlined, in which correspondence relationships are established between organism structures. One structure is homologous to another when inherited from a common ancestor. When there is an error in proposing a hypothesis of homology, this is called homoplasy.
The collected characteristics are compiled into a character matrix. In a character matrix, rows represent organisms and columns represent traits, indicating the state of each trait for each organism. In the case of molecular data, each site observed in a given sequence is considered a character. The character matrix helps organize information to be transposed into a cladogram.
The character matrix is then analyzed in order to try to define the derived states of each character (apomorphies) and the ancestral states (plesiomorphies). This analysis is done by an algorithm which attempts to reconcile the state changes observed in the matrix with a phylogenetic tree that explains such changes in the simplest way possible, using the principle of parsimony.
Know more: What does the theory of natural selection state?
How do you read a cladogram?
In a cladogram, the greater proximity of two elements compared to a third is interpreted as a reflection of the evolutionary history of these taxa, and they are called sister groups. The bifurcations in the cladogram represent the points at which lineages splitover time. The branching order is represented by the root, as the oldest evolutionary event, towards the terminals, which represent recent events.
Branch lengths do not represent units of time, that is, the length of one branch in relation to another tells us the same thing. Furthermore, you cladograms can have different aesthetic representations, with more square branches, for example. It is important to highlight that inverting a cladogram does not change the relationships between taxa.

It is possible to observe the presence of three types of groupings in the hypotheses represented by the cladograms, despite cladistics only recognizing the existence of monophyletic groups:
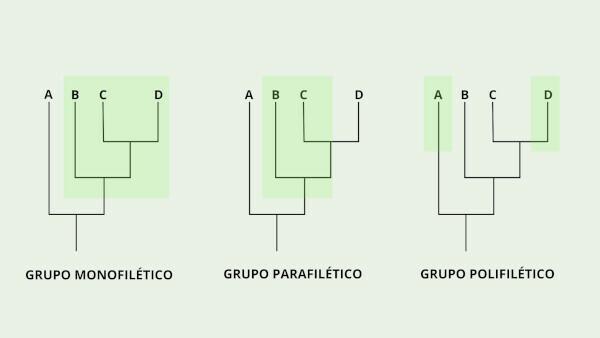
- Monophyletic group: It is a group considered natural, being formed exclusively by an ancestral species and all its descendants. Monophyletic groups are also known as clades and are diagnosable by the presence of synapomorphies.
- Paraphyletic group: It is a group considered artificial, as it is formed by an ancestral species and part of its descendant species, but not all. It is supported by the presence of plesiomorphies and the absence of synapomorphies.
- Polyphyletic group: is an artificial group formed by species descended from several ancestors.
Image credits
[1]Wikimedia Commons
Sources
AMORIM, D. S. 2002. Fundamentals of phylogenetic systematics. Ribeirão Preto: Holos Editora. 136 p.
JUSTINA, L. A. D., MEGLHIORATTI, F.A. & RODRIGUES, M.E. 2011. The content of systematics and phylogenetics in high school textbooks. Rev. Essay, 13(2): 65-84.
LOPES, S. G. B. W. & CHOW HO, F. F. Topic 4. Basic notions of phylogenetic systematics. In: Life and Environment – Biological Diversity and Phylogeny. Degree in Sciences – USP/Univesp. P. 54-67.
SANTOS, C. M. D. & CALOR, A. A. 2007. Teaching evolutionary biology using the conceptual structure of phylogenetic systematics – I. Science & Teaching, 1(2).
WILEY, E. O. & LIEBERMAN, B. S. 2011. Phylogenetics: the theory and practice of phylogenetic systematics. 2. ed. Oxford: Wiley. 406 p.
Would you like to reference this text in a school or academic work? Look:
FLORES, Heloísa Fernandes. "Cladogram"; Brazil School. Available in: https://brasilescola.uol.com.br/biologia/cladograma.htm. Accessed on December 3, 2023.