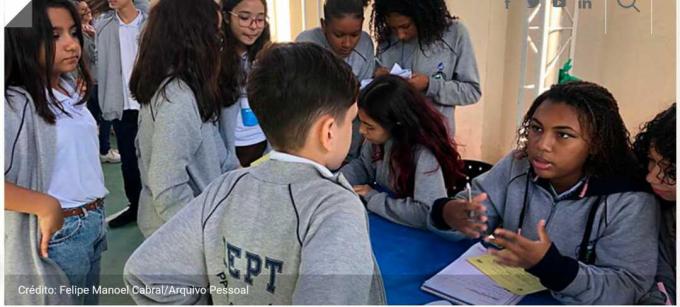
In an innovative initiative, the teachers from the Instituto de Educação Paulo de Tarso, in Nova Iguaçu (RJ), found a creative way to stimulate the motivation and interest of 9th grade students in mathematics.
In the project “School Minicense: Statistics and Society”, students were challenged to reflect and debate on relevant topics involving the collection of population data in Brazil.
see more
Attention, teachers: classroom organization can improve…
Forum wants education with a neutral rate in the tax reform
In five distinct steps, students were encouraged to explore various issues.
Conversation circle and surveys promote reflection and investigation on IBGE data

Photo of the project in progress. (Image: playback)
The initiative provided a completely interactive approach, involving all students and encouraging them to make public their personal experiences related to the entire course of the work.
In the first stage, students gathered in a conversation circle, in which they could debate and reflect on the relevance of statistical data in their daily lives.
The topics addressed were varied and included Religion, Color/Race, People per Household, BMI (Body Mass Index), Age and Area of Knowledge.
Students had the opportunity to share their experiences and perceptions, enriching the debate and expanding collective knowledge.
Then, participants were divided into groups to carry out surveys based on data collected by the renowned Brazilian Institute of Geography and Statistics (IBGE).
This type of work with the students ensured a completely different experience, making it possible to approach more investigative concepts and encouraging students to seek reliable and relevant sources to support their arguments.
Each group had the autonomy to choose the topics to be researched, taking into account individual preferences and interests.
Process of working with students
After separating the groups, the idea of using the Google Forms for collection. However, they opted for the traditional method, using Excel, so that they could have the experience of analyzing and detailing the statistics, in addition to using the graphical tool.
The forms with the options were customized by each group. According to one of the teachers, he only organized a model for printing, in addition to providing guidelines and making the necessary adjustments.
The development of data collection was an indispensable phase to ensure that students had a well-established and effective plan to obtain the maximum amount of information. Precisely for this reason, each group developed its own plan of action.
In these achievements, the topics of interest and research methods were guided. This activity ended up stimulating not only the organization, but also the autonomy of the students.
This was because they were encouraged to think strategically about how to ethically and accurately collect relevant data.
Students collect data from the community
With carefully defined planning, students applied forms not only among their own classes, but also among other peers and members of the school community.
This enriching experience allowed students to obtain information directly from their peers and the local community, bringing them closer to the social reality in which they are inserted. In all, an impressive 115 interviews were carried out, demonstrating the commitment and dedication of the students.
After the data collection phase, the groups dedicated themselves to tabulating the information and building graphs to be able to measure the results.
This step was essential for students to be able to apply the statistical concepts learned in the classroom and put them into practice in a concrete way.
