Tables, charts and figures are elements used in academic works. They have differences and specifications defined by the Brazilian Association of Technical Standards (ABNT).
Tables are formed by vertical lines, must keep their side edges open and are generally used for quantitative data.
Frames, on the other hand, are formed by vertical and horizontal lines, must have all their ends closed and are more used for qualitative data.
Finally, the figures are illustrative elements, which can be in the form of photos, maps, graphs, engravings, etc.
| Table | Frame | Figures | |
|---|---|---|---|
| Format | Side edges cannot be closed. |
The ends must be closed. | They can be in the form of photos, maps, graphics, engravings, etc. |
| Use | Usually for quantitative data. | Usually for qualitative data. | Illustrate information and data. |
| Elements | Title, header, content, source and, if necessary, explanatory notes. | Title, source, caption and notes. | Title, numbering and font. |
| Division | Formed by vertical lines. | Formed by horizontal and vertical lines. | - |
| Formatting | The table number and title must appear above it, while the source must appear below. | The frame number and title should appear above it, while the font should appear below. | The number and title should appear at the top, while the font should appear at the bottom. |
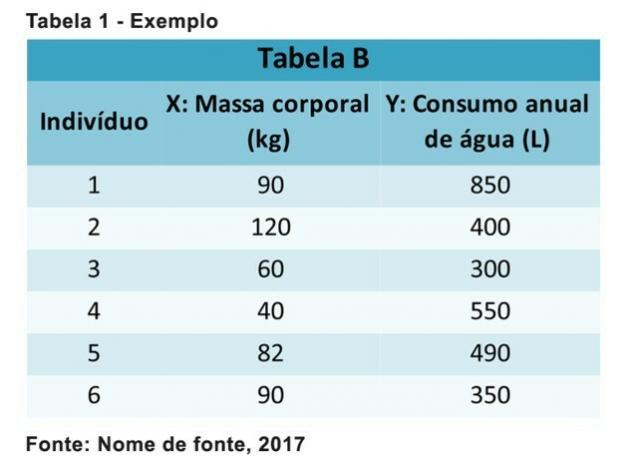
What is a table?
Tables are generally used for quantitative data and are made up of vertical columns, where each column has a header or title. Their side borders cannot be closed, that is, the tables have an open format.
Basically, they are used to represent data in a simple way, and usually appear in the results part of the work or in its discussion. According to ABNT, data with statistical treatment must be presented in table format.
The title of a table should be at the top, and should indicate the temporal and geographic coverage of the data. The citation of the source is mandatory and must be indicated below the table.
table example
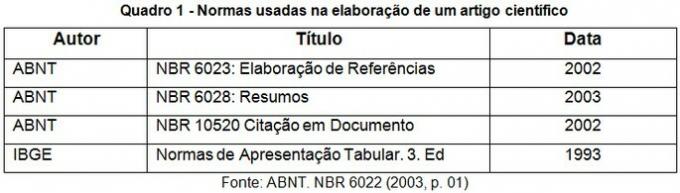
What is a frame?
According to ABNT, tables are considered illustrations, being used to present theoretical content, such as comparisons, classifications and numerical data without statistical treatment. Generally, tables present qualitative data.
It is formed by horizontal and vertical lines and has a closed format, that is, with a frame around its lines and columns.
Your spacing and font don't have to follow the same pattern as the rest of the text.
example of frame

See also the difference about the descriptive, exploratory and explanatory research.
What is a figure?
Figures are any illustrations other than tables or charts. They can be drawings, photos, graphics, clip art, prints, etc.
Figures can be used in any part of the work, but they should be as close as possible to the part they are intended to illustrate. They can be scanned, created by some application or copied and pasted.
The identification of figures must appear at the top, containing title and order number of occurrence in the text (in Arabic numerals). The same typology of the primary sections of the work must be used.
According to ABNT, the indication of the font must be at the bottom of the figure, using font size 10 and simple spacing.
figure example

See also the difference between:
- annex and appendix
- General objectives and specific objectives
- Lenght, width and height