Absolute frequency is the number of times each item in a statistical survey occurs. This number represents how many times a variable was answered or observed.
The idea of frequency refers to repetitions of something and, in statistics, they inform about the occurrences or achievements of the researched variables.
In statistical research, after data are collected, it is useful to organize them into tables to facilitate reading and interpretation. These tables are called frequency tables. These tables record the simple absolute frequency and the cumulative absolute frequency, in addition to other values.
Simple Absolute Frequency
The simple absolute frequency, or absolute frequency, is the record of the number of repetitions of a studied variable. As it is a count, it is represented by natural numbers, which means that the absolute frequency is a discrete quantity.
Example
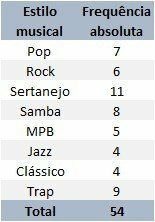
A survey was conducted with 3rd year high school students where they were asked about their musical style preferences. A total of 54 students responded to the survey.
The result was organized and presented in the following table of frequencies:

What is the absolute frequency of the samba variable?
Resolution
Variables are musical styles, and absolute frequencies are the number of responses for each.
The attendance table shows us that eight students answered Samba. Thus, the absolute frequency of the Samba variable is 8.
Accumulated Absolute Frequency
The accumulated absolute frequency, or, accumulated frequency, is the sum of the simple absolute frequencies of each variable. In the accumulated absolute frequency, the numerical values are added, accumulating, from one variable to the other, up to the last variable studied.
Example
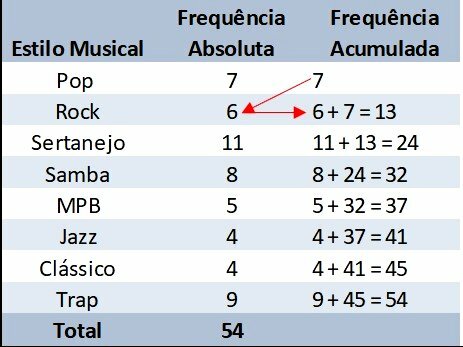
Completing the table in the previous example, we have:

In the accumulated frequency, to each line we add the absolute frequency with the previous accumulated. Thus, we are accumulating the values for each row of the table.
The last line of the column of accumulated frequency already represents the total number of respondents.
Absolute Frequency Exercises
Exercise 1
The following table of frequencies shows the number of users of vehicles powered by gasoline, alcohol, flex and diesel, who filled up at a gas station in the last hour. Determines the absolute frequency of flex vehicle users.
| Gasoline | 23 |
|---|---|
| alcohol | 16 |
| flex | |
| diesel | 8 |
| TOTAL | 61 |
Correct answer: 14 flex vehicles refueled in the last hour.
The total number of customers who filled up in the last hour is the sum of the absolute frequencies of vehicles for each fuel.
23 + 16 + flex + 8 = 61
Solving the equation for the flex variable, we have:
flex = 61 - 23 - 16 - 8
flex = 14
Therefore, 14 flex vehicles filled up in the last hour.
Exercise 2
A survey gathered information about voters' voting intentions for six candidates who will run in the next elections for the manager of a large condominium.
| Candidates | Absolute Frequency |
|---|---|
| THE | 98 |
| B | 67 |
| Ç | 143 |
| D | 178 |
| AND | 86 |
| F | 76 |
Build a column with the cumulative absolute frequency and answer what the total number of voters responded to the poll.
We will use the same table as the question as a basis.
To build the cumulative frequency table, we have to repeat the first value, 98. Afterwards, we add the absolute value of the next row, until the table is complete.
| Candidates | Absolute Frequency | Cumulative frequency |
|---|---|---|
| THE | 98 | 98 |
| B | 67 | 165 |
| Ç | 143 | 308 |
| D | 178 | 486 |
| AND | 86 | 572 |
| F | 76 | 648 |
The total number of voters is represented in the last line, being 648.
Exercise 3
(EEAR 2009) If the absolute frequencies of the 1st to 6th classes of a distribution are, respectively, 5, 13, 20, 30, 24 and 8, then the cumulative frequency of the 4th class of that distribution is
a) 68.
b) 82.
c) 28%.
d) 20%.
Correct answer: a) 68.
Organizing the data in a frequency table, we will have:
| Absolute Frequency | Cumulative frequency | |
|---|---|---|
| 1st class | 5 | 5 |
| 2nd class | 13 | 18 |
| 3rd class | 20 | 38 |
| 4th class | 30 | 68 |
Therefore, in the 4th grade, the cumulative frequency is 68.
You may be interested in:
- Relative Frequency
- Average, Fashion and Median
- median
- Arithmetic average
- Weighted Arithmetic Average
- Statistic
- Geometric Mean
- Dispersion Measures
- Variance and standard deviation
Practice exercises on:
- Arithmetic Average Exercises
- Statistics - Exercises
- Average, Fashion and Median exercises


