When working with functions, the construction of graphs is extremely important. We can say that just as we see our image reflected in the mirror, the graph of a function is its reflection. Through the graph, we can define what type the function is even without knowing its formation law. That's because each function has its graphic representation private.
Regardless of the function worked, it is essential to know some definitions:
Cartesian Plan → it is the environment where the graph will be built. It is established by the meeting of the Cartesian axes x and y, known as abscissa axis and ordinate axis, respectively.
Each point on the graph is known as ordered pair, as it is formed by the meeting of an abscissa value with an ordinate value. The line joining the ordered pairs is known as the function curve.

Representation of the coordinate point (1,2) in the Cartesian plane
Here are some basic principles for building the graph of a function, whether it is a 1st degree function or a 2nd degree function.
1°) Choose values for x
To start building the graph, it is necessary to choose values for the variable x. These values will be substituted into the function formation law so that the corresponding value of y be determined as well as the ordered pair. To graph a 1st degree function, it is only necessary to find two points that we have already visualized in the graph.
Do not stop now... There's more after the advertising ;)
It is also important to choose close values, such as subsequent numbers. Also, it's always good to know the points where x = 0 and y = 0 (zero of the function).
Consider the function y = x + 1. We will set up a table with the values of x to find the values of y:
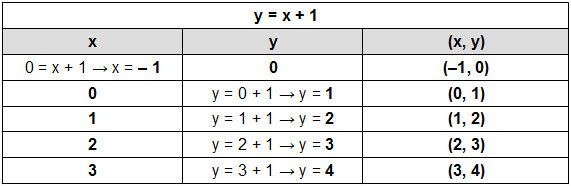
2°) Find the pairs ordered in the Cartesian plane
Launching each of these pairs ordered in the Cartesian plane, we find the following points:

Ordered pairs released on the Cartesian plane
3°) Drawing the graph
Just connect the points through a straight line to determine the graph of the function. y = x + 1.

Graph of the function y = x + 1
By Amanda Gonçalves
Graduated in Mathematics
Would you like to reference this text in a school or academic work? Look:
RIBEIRO, Amanda Gonçalves. "How to graph a function?"; Brazil School. Available in: https://brasilescola.uol.com.br/matematica/como-construir-grafico-uma-funcao.htm. Accessed on July 27, 2021.