Standard deviation is a measure that expresses the degree of dispersion of a data set. That is, the standard deviation indicates how uniform a data set is. The closer to 0 the standard deviation, the more homogeneous the data.
How to calculate standard deviation
The standard deviation (SD) is calculated using the following formula:

Being,
∑: sum symbol. Indicates that we have to add all terms, from the first position (i=1) to position n
xi: value in position i in the dataset
MTHE: arithmetic mean of the data
n: amount of data
Example
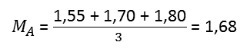
In a rowing team, athletes have the following heights: 1.55 m; 1.70 m and 1.80 m. What is the mean and standard deviation of this team's height?
Calculation of the average, where n = 3
Standard deviation calculation

Also read about Dispersion Measures.
Variance and Standard Deviation
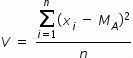
Variance is a measure of dispersion and is also used to express how far a data set deviates from the mean.
Standard deviation (SD) is defined as the square root of the variance (V).
The advantage of using standard deviation instead of variance is that the standard deviation is expressed in the same unit as the data, which makes comparison easier.
variance formula
know more about Variance and Standard Deviation.
Solved Exercises
1) ENEM - 2016
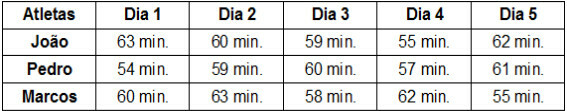
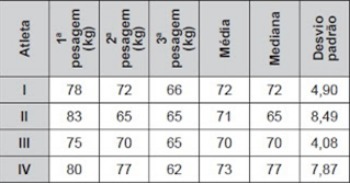
The Rapid "Weight Loss" Procedure is common among combat sports athletes. To participate in a tournament, four athletes from the 66 kg category, Featherweight, were submitted to balanced diets and physical activities. They carried out three "weigh-ins" before the start of the tournament. According to the tournament regulations, the first fight must take place between the most regular athlete and the least regular in terms of "weights". Information based on athletes' weights is on the board.
After the three "weigh-ins", the organizers of the tournament informed the athletes which of them would face each other in the first fight.
The first fight was between athletes
a) I and III.
b) I and IV.
c) II and III.
d) II and IV.
e) III and IV
To find the most regular athletes we will use the standard deviation, as this measure indicates how much the value deviated from the mean.
Athlete III is the one with the smallest standard deviation (4.08), so it is the most regular. The least regular is athlete II with the highest standard deviation (8.49).
Correct alternative c: II and III
2) ENEM - 2012
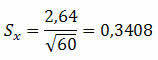
An irrigated coffee producer in Minas Gerais received a statistical consultancy report, including, among other information, the standard deviation of the productions of a crop of the plots of its property. The plots have the same area of 30,000 m2 and the value obtained for the standard deviation was 90 kg/plot. The producer must present the information on the production and the variance of these productions in bags of 60 kg per hectare (10 000 m).2). The variance of the productions of the plots expressed in (sacks/hectare)2 é:
a) 20.25
b) 4.50
c) 0.71
d) 0.50
e) 0.25.
How the variance should be in (sacks/hectare)2, we need to transform the measurement units.
Each plot is 30,000 m2 and each hectare is 10,000 m2, so we should divide the standard deviation by 3. We found the value of 30 kg/hectare. As the variance is given in bags of 60 kg per hectare then we have that the standard deviation will be 0.5 bags/hectare. The variance will be equal to (0.5)2 .
Correct alternative e: 0.25
3) ENEM – 2010
Marco and Paulo were classified in a contest. For classification in the contest, the candidate should obtain an arithmetic average in the score equal to or greater than 14. In case of a tie in the average, the tie would be in favor of a more regular score. The table below shows the points obtained in the Mathematics, Portuguese and General Knowledge tests, the mean, median and standard deviation of the two candidates.
Candidate data in the competition

The candidate with the most regular score, therefore the highest ranked in the competition, is
a) Marco, as the mean and median are the same.
b) Marco, as it had a lower standard deviation.
c) Paulo, as he obtained the highest score in the table, 19 in Portuguese.
d) Paulo, as he obtained the highest median.
e) Paulo, as he had a higher standard deviation.
As the average of Marco and Paulo were equal, the tie will be done by the smallest value of the standard deviation, as it is what indicates a more regular score.
Correct alternative b: Marco, as it obtained the lowest standard deviation.
To learn more, see also:
- Average
- Geometric Mean
- Average, Fashion and Median
- Statistic
- Statistics - Exercises
- Types of Graphics