You numerical sets include the following sets: Naturals (ℕ), Integers (ℤ), Rationals (ℚ), Irrationals (I), Reals (ℝ) and Complexes (ℂ).
Take advantage of the exercises commented to check your knowledge on this important subject of Mathematics.
question 1
Which proposition below is true?
a) Every whole number is rational and every real number is an integer.
b) The intersection of the set of rational numbers with the set of irrational numbers has 1 element.
c) The number 1.83333... is a rational number.
d) The division of two whole numbers is always a whole number.
Correct alternative: c) The number 1.83333... is a rational number.
Let's look at each of the statements:
a) False. Actually every whole number is rational, as it can be written in the form of a fraction. For example, the number -7, which is an integer, can be written as a fraction as -7/1. However, not every real number is an integer, for example 1/2 is not an integer.
b) False. The set of rational numbers has no number in common with the irrational ones, as a real number is either rational or irrational. Therefore, the intersection is an empty set.
c) True. The number 1.83333... it is a periodic tithe because the digit 3 repeats itself infinitely. This number can be written as a fraction as 11/6, so it is a rational number.
d) False. For example, 7 divided by 3 is equal to 2.33333..., which is a periodic decimal, so it's not a whole number.
question 2
The value of the expression below, when a = 6 and b = 9, is:
a) an odd natural number
b) a number that belongs to the set of irrational numbers
c) is not a real number
d) an integer whose modulus is greater than 2
Correct alternative: d) an integer whose modulus is greater than 2.
First let's replace the letters with the indicated values and solve the expression:
Note that (-6)2 is different from - 62, the first operation can be done as: (-6)2 = (- 6). (- 6) = 36. Without the parentheses, only 6 is squared, ie - 62 = - (6.6) = -36.
Continuing the resolution, we have:
Note that since the index of the root is an odd number (cubic root), there is a negative number root in the set of real numbers. If the root index were an even number, the result would be a complex number.
Now, let's analyze each of the options presented:
The option The is wrong because the answer is a negative number that is not part of the set of natural numbers.
The number - 3 is not an infinite non-periodic decimal, so it is not an irrational, hence the letter B it's not the right solution either.
The letter ç is also wrong, since the number - 3 is a number belonging to the set of real numbers.
The correct option can only be the letter d and actually the result of the expression is an integer and the modulo of -3 is 3 which is greater than 2.
question 3
In sets (A and B) in the table below, which alternative represents an inclusion relationship?
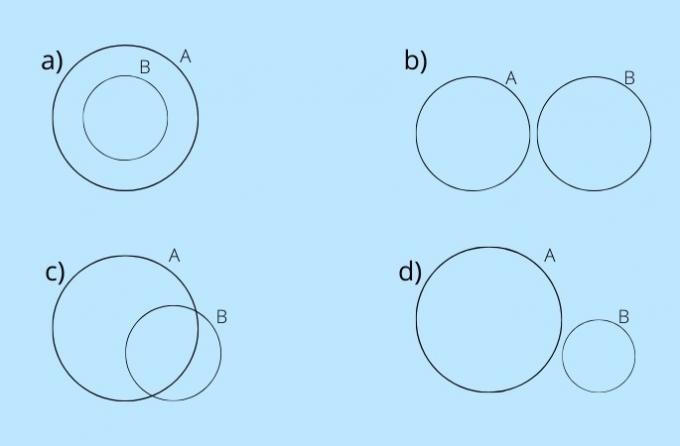
Correct alternative: a)
Alternative "a" is the only one in which one set is included in another. Set A includes set B or Set B is included in A.
So which statements are correct?
I - A C B
II - B C A
III - A B
IV - B Ɔ A
a) I and II.
b) I and III.
c) I and IV.
d) II and III.
e) II and IV
Correct alternative: d) II and III.
I - Wrong - A is not contained in B (A Ȼ B).
II - Correct - B is contained in A (B C A).
III - Correct - A contains B (B Ɔ A).
IV - Wrong - B does not contain A (B ⊅ A).
question 4
We have the set A = {1, 2, 4, 8 and 16} and the set B = {2, 4, 6, 8 and 10}. According to the alternatives, where are elements 2, 4 and 8 located?
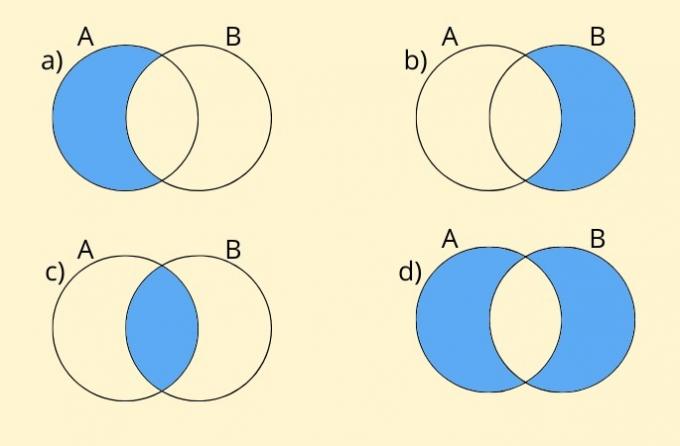
Correct alternative: c).
Elements 2, 4 and 8 are common to both sets. Therefore, they are located in the subset A ∩ B (A intersection with B).
question 5
Given sets A, B and C, which image represents A U (B ∩ C)?
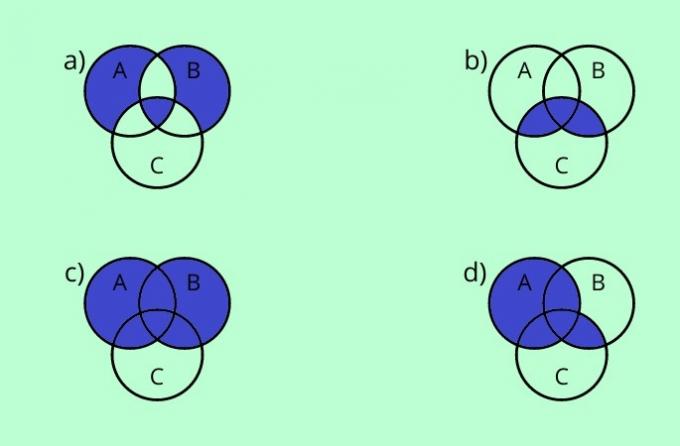
Correct alternative: d)
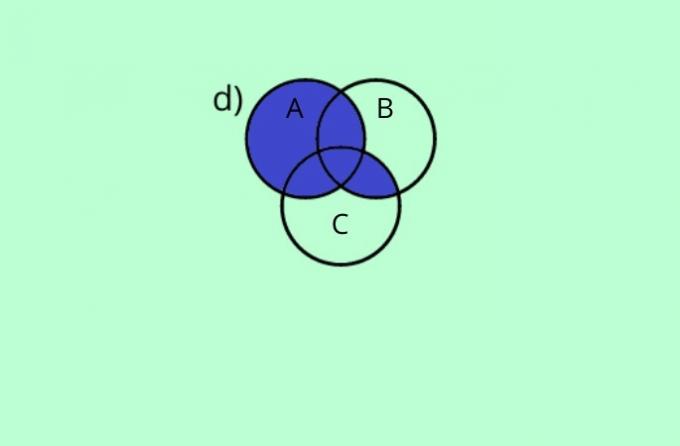
The only alternative that satisfies the initial condition of B ∩ C (because of the parentheses) and, later, the union with A.
question 6
A survey was carried out to learn about the purchasing habits of consumers in relation to three products. The research obtained the following results:
- 40% buy product A.
- 25% buy product B.
- 33% buy product C.
- 20% buy products A and B.
- 5% buy products B and C.
- 19% buy products A and C.
- 2% buy all three products.
Based on these results, answer:
a) What percentage of respondents do not buy any of these products?
b) What percentage of respondents buy product A and B and do not buy product C?
c) What percentage of respondents buy at least one of the products?
Answers:
a) 44% of respondents do not consume any of the three products.
b) 18% of people who consume both products (A and B) do not consume product C.
c) 56% of respondents consume at least one of the products.
To solve this problem, let's make a diagram to better visualize the situation.
We must always start at the intersection of the three sets. Then we'll include the value of the intersection of two sets, and finally, the percentage of people who only buy a single brand of product.
It is noticed that the percentage of people who consume two products also includes the percentage of people who consume the three products.
Therefore, in the diagram we indicate the percentage of those who consume only two products. To do this, we must subtract the percentage of those who consume the three products from those who consume two.
For example, the indicated percentage that consumes product A and product B is 20%, however this value includes the 2% related to who consumes the three products.
By subtracting these values, ie 20% - 2% = 18%, we find the percentage of consumers who buy products A and B only.
Considering these calculations, the diagram for the situation described will be as shown in the figure below:
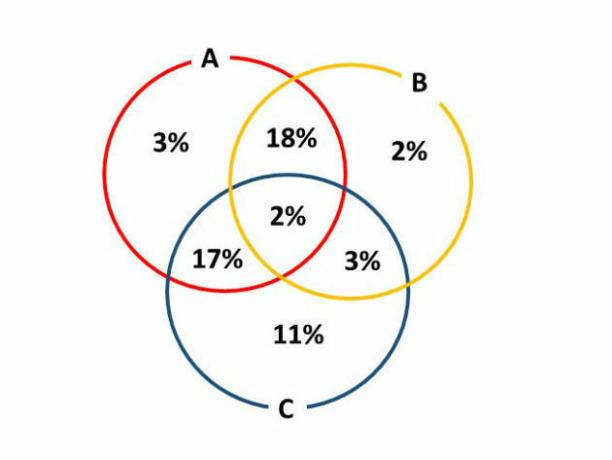
Based on this diagram, we can now go on to answer the proposed questions.
The) The percentage of those who do not buy any product is equal to the whole, that is, 100% except that they consume any product. So, we must do the following calculation:
100 - (3 + 18 + 2 + 17 + 2 + 3 + 11) = 100 - 56 = 44%
Soon, 44% of respondents do not consume any of the three products.
B) The percentage of consumers who buy product A and B and do not buy product C is found by subtracting:
20 - 2 = 18%
Therefore, 18% of people who consume both products (A and B) do not consume product C.
ç) To find the percentage of people who consume at least one of the products, just add up all the values in the diagram. So we have:
3 + 18 + 2 + 17 + 2 + 3 + 11 = 56%
Thus, 56% of respondents consume at least one of the products.
question 7
(Enem/2004) A cosmetics manufacturer decides to produce three different catalogs of its products, targeting different audiences. As some products will be present in more than one catalog and occupy an entire page, he decides to do a count to reduce expenses with print originals. Catalogs C1, C2 and C3 will have, respectively, 50, 45 and 40 pages. Comparing the designs from each catalog, he finds that C1 and C2 will have 10 pages in common; C1 and C3 will have 6 pages in common; C2 and C3 will have 5 pages in common, of which 4 will also be on C1. Performing the corresponding calculations, the manufacturer concluded that, for the assembly of the three catalogs, it will need a total of print originals equal to:
a) 135
b) 126
c) 118
d) 114
e) 110
Correct alternative: c) 118
We can solve this question by constructing a diagram. For this, let's start with the pages that are common to the three catalogues, that is, 4 pages.
From there, we will indicate the values, subtracting those that have already been accounted for. Thus, the diagram will be as indicated below:
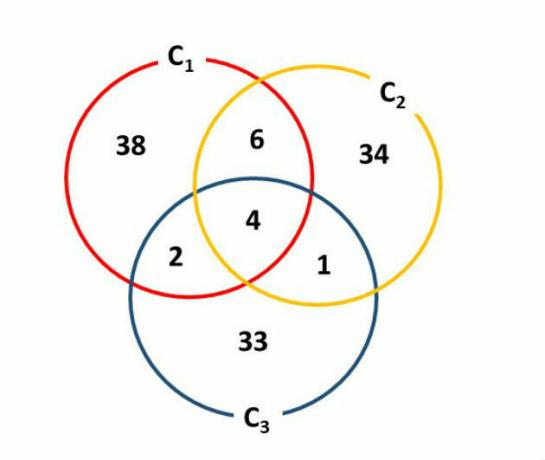
The values were found by making the following calculations:
- Intersection C1, C2 and C3: 4
- Intersection C2, C3: 5 - 4 = 1
- Intersection C1 and C3: 6 - 4 = 2
- Intersection C1 and C2: 10 - 4 = 6
- Only C1: 50 - 12 = 38
- C2 only: 45 - 11 = 34
- C3 only: 40 - 7 = 33
To find the number of pages, just add all these values, ie:
4 + 1 + 2 + 6 + 38 +34 + 33 = 118
question 8
(Enem/2017) In this thermometer model, the fillets record the minimum and maximum temperatures of the previous day and the gray fillets record the current ambient temperature, that is, at the time of reading the thermometer.
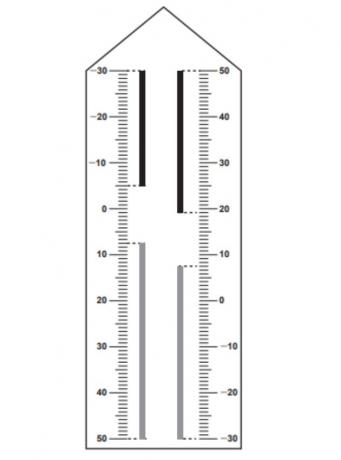
So it has two columns. On the left, the numbers are in ascending order, from top to bottom, from -30 °C to 50 °C. In the column on the right, the numbers are ordered in ascending order, from the bottom to the top, from -30°C to 50°C.
Reading is done as follows:
- the minimum temperature is indicated by the lower level of the black fillet in the left column.
- the maximum temperature is indicated by the lower level of the black fillet in the right column.
- the current temperature is indicated by the top level in the gray fillets in the two columns.
What is the closest maximum temperature recorded on this thermometer?
a) 5 °C
b) 7°C
c) 13°C
d) 15°C
e) 19°C
Correct alternative: e) 19°C
To resolve the issue, just read the scale in the right column of the black fillet, which represents the maximum temperature record.
question 9
(Enem /2017) The result of an electoral survey, on voters' preference in relation to two candidates, was represented by means of Graph 1.
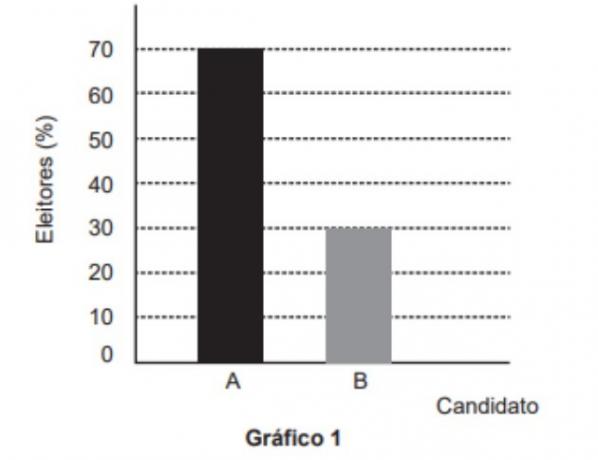
When this result was published in a newspaper, Graph 1 was cut during the layout, as shown in Graph 2.
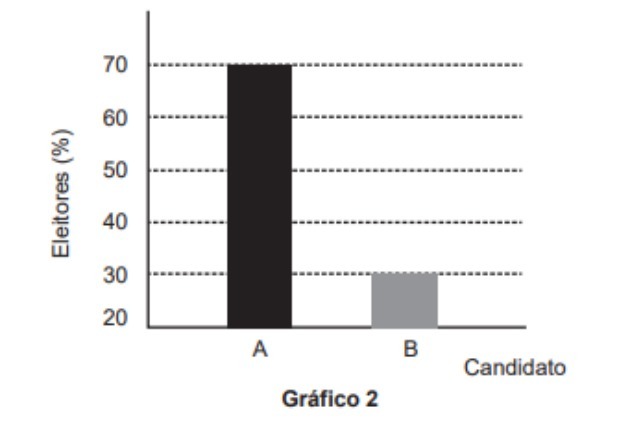
Although the values presented are correct and the width of the columns is the same, many readers criticized the format of Graph 2 printed in the newspaper, claiming that there was visual damage to the candidate B. The difference between the height ratios of column B to column A in graphs 1 and 2 is:
a) 0
b) 1/2
c) 1/5
d) 2/15
e) 8/35
Correct alternative: e) 8/35
To resolve the issue, we first need to find the ratio of the height of column B to column A in the two graphs. These ratios are found by counting how many divisions there are in each column.
Note that in graph 1, column A is divided into 7 equal "pieces", while column B into 3. In graph 2, column A is divided into 5 equal "pieces" and column B into only 1.
Therefore, the fractions that represent the ratios of the height of column B to column A can be indicated by
Now just solve the subtraction between these two fractions, So we have:
question 10
(Enem/2018) To create a logo, a professional in the field of graphic design wants to build it using the set of points in the plane in the shape of a triangle, exactly as shown in the image.
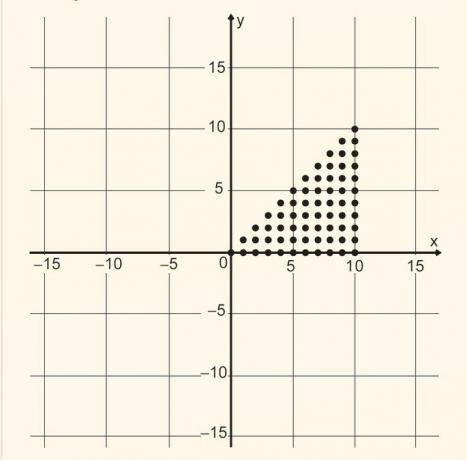
To build such an image using a graphic tool, it will be necessary to write algebraically the set that represents the points of this graphic.
This set is given by the ordered pairs (x; y) ℕ x ℕ, such that
a) 0 ≤. x ≤ y ≤ 10
b) 0 ≤ y ≤ x ≤ 10
c) 0 ≤ x ≤ 10, 0 ≤ y ≤ 10
d) 0 ≤ x + y ≤ 10
e) 0 ≤ x + y ≤ 20
Correct alternative: b) 0 ≤ y ≤ x ≤ 10
Note that the figure expressed in the question, both on the y and x axis, comprises the natural numbers (ℕ x ℕ) between 0 and 10. We have to: 0 ≤ y ≤ 10 and 0 ≤ x ≤ 10.
Thus: y = (0.1,2,3,4,5,6,7,8,9,10) and x = (0, 1,2,3,4,5,6,7,8,9, 10). However, the figure depicted is a triangle. To satisfy this condition, in ordered pairs y cannot be greater than x.
Note that the values of y are limited by equality with the values of x, forming the hypotenuse of this right triangle: (0,0), (1;1), (2;2), (3;3), (4; 4), (5;5)...(10;10).

Thus, we have to: y ≤ x.
Soon, 0 ≤ y ≤ x ≤ 10.
To learn more, read also:
- Numerical sets
- real numbers
- Integers
- Rational Numbers
- irrational numbers
- Natural Numbers
- Complex numbers
- Exercises on Sets
- Exercises on Complex Numbers