Statistics is the area of Mathematics that studies the collection, recording, organization and analysis of research data.
This subject is charged in many contests. So, take advantage of the exercises commented and solved to solve all your doubts.
Commented and Resolved Issues
1) Enem - 2017
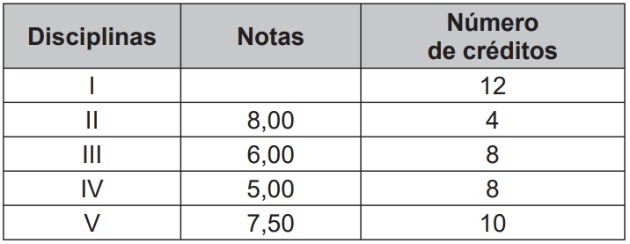
The performance evaluation of students in a university course is based on the weighted average of the grades obtained in the subjects by the respective number of credits, as shown in the table:

The better the assessment of a student in a given academic term, the greater his priority in choosing subjects for the next term.
A certain student knows that if he obtains a “Good” or “Excellent” assessment, he will be able to enroll in the subjects he desires. He has already taken the tests for 4 of the 5 subjects he is enrolled in, but he has not yet taken the test for subject I, as shown in the table.
In order for him to reach his goal, the minimum grade he must achieve in subject I is
a) 7.00.
b) 7.38.
c) 7.50.
d) 8.25.
e) 9.00.
To calculate the weighted average, we will multiply each grade by its respective number of credits, then add all the values found and finally, divide by the total number of credits.
Through the first table, we identify that the student must reach at least an average equal to 7 to obtain the "good" evaluation. Therefore, the weighted average must equal this value.
Calling the missing note of x, let's solve the following equation:
Alternative: d) 8.25
2) Enem - 2017
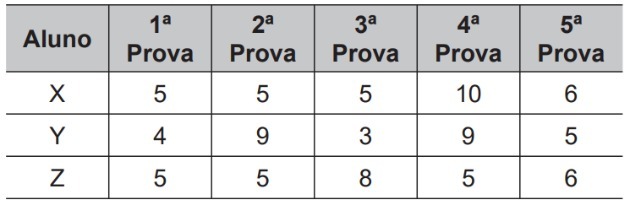
Three students, X, Y and Z, are enrolled in an English course. To assess these students, the teacher chose to take five tests. In order to pass this course, the student must have the arithmetic average of the grades of the five tests greater than or equal to 6. In the table, the notes that each student took in each test are displayed.
Based on the data in the table and the information given, you will be disapproved
a) only student Y.
b) only student Z.
c) only students X and Y.
d) only students X and Z.
e) students X, Y and Z.
The arithmetic mean is calculated by adding all the values and dividing by the number of values. In this case, let's add up each student's grades and divide by five.
As the student will pass with a grade equal to or greater than 6, then students X and Y will pass and student Z will fail.
Alternative: b) only student Z.
3) Enem - 2017
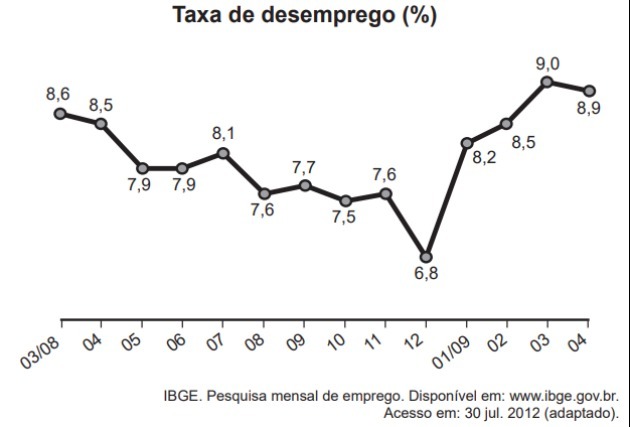
The graph shows the unemployment rate (in %) for the period from March 2008 to April 2009, obtained based on the data observed in the metropolitan regions of Recife, Salvador, Belo Horizonte, Rio de Janeiro, São Paulo and Porto Happy.
The median of this unemployment rate, in the period from March 2008 to April 2009, was
a) 8.1%
b) 8.0%
c) 7.9%
d) 7.7%
e) 7.6%
To find the median value, we must start by putting all values in order. We then identify the position that divides the range in two with the same number of values.
When the number of values is odd, the median is the number that is exactly in the middle of the range. When it is even, the median is equal to the arithmetic mean of the two central values.
Observing the graph, we identify that there are 14 values related to the unemployment rate. Since 14 is an even number, the median will equal the arithmetic mean between the 7th value and the 8th value.
In this way, we can put the numbers in order until we reach these positions, as shown below:
6,8; 7,5; 7,6; 7,6; 7,7; 7,9; 7,9; 8,1
Calculating the average between 7.9 and 8.1, we have:
Alternative: b) 8.0%
4) Fuvest - 2016
A vehicle travels between two towns in Serra da Mantiqueira, covering the first third of the route at an average speed of 60 km/h, the next third at 40 km/h and the rest of the route at 20 km/h. The value that best approximates the average speed of the vehicle on this trip, in km/h, is
a) 32.5
b) 35
c) 37.5
d) 40
e) 42.5
We need to find the mean velocity value and not the mean of the velocities, in this case, we cannot calculate the arithmetic mean but the harmonic mean.
We use the harmonic mean when the quantities involved are inversely proportional, as in the case of velocity and time.
The harmonic mean being the inverse of the arithmetic mean of the inverses of the values, we have:
Therefore, the closest value in the answers is 32.5 km/h
Alternative: a) 32.5
5) Enem - 2015
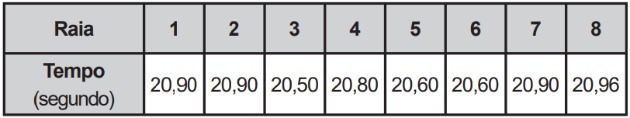
In a selective for the final of the 100 meters freestyle swimming, in an Olympics, the athletes, in their respective lanes, obtained the following times:
The median of the times shown in the table is
a) 20.70.
b) 20.77.
c) 20.80.
d) 20.85.
e) 20.90.
First, let's put all values, including repeated numbers, in ascending order:
20,50; 20,60; 20,60; 20,80; 20,90; 20,90; 20,90; 20,96
Note that there is an even number of values (8 times), so the median will be the arithmetic mean between the value that is in the 4th position and that of the 5th position:
Alternative: d) 20.85.
6) Enem - 2014
Candidates K, L, M, N and P are competing for a single job opening at a company and have taken tests in Portuguese, mathematics, law and IT. The table shows the scores obtained by the five candidates.
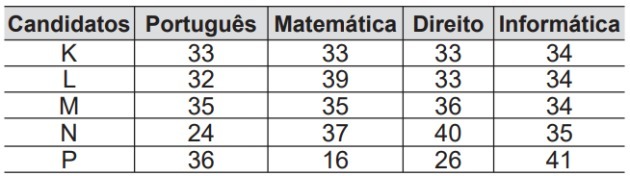
According to the selection notice, the successful candidate will be the one for whom the median of the grades obtained by him in the four subjects is the highest. The successful candidate will be
a) K.
b) L.
c)
d) No.
e) Q
We need to find each candidate's median to identify which is the highest. For that, let's put the grades of each one in order and find the median.
Candidate K:
Candidate L:
Candidate M:
Candidate N:
Candidate P:
Alternative: d) N
See too Mathematics in Enem and Math Formulas
7) Fuvest - 2015
Examine the chart.
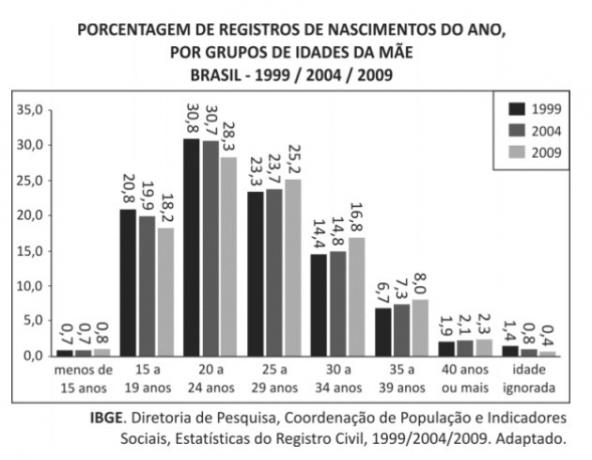
Based on the data in the graph, it can be correctly stated that age
a) median of mothers of children born in 2009 was greater than 27 years.
b) median of mothers of children born in 2009 was less than 23 years.
c) median of mothers of children born in 1999 was greater than 25 years.
d) mean of mothers of children born in 2004 was greater than 22 years.
e) mean of mothers of children born in 1999 was less than 21 years.
Let's start by identifying in which range the median of mothers of children born in 2009 is located (light gray bars).
For this, we will consider that the median of the ages is located at the point where the frequency adds up to 50% (middle of the range).
In this way, we will calculate the accumulated frequencies. In the table below, we indicate the frequencies and cumulative frequencies for each interval:
| age ranges | Frequency | Cumulative frequency |
| under 15 years | 0,8 | 0,8 |
| 15 to 19 years old | 18,2 | 19,0 |
| 20 to 24 years old | 28,3 | 47,3 |
| 25 to 29 years old | 25,2 | 72,5 |
| 30 to 34 years old | 16,8 | 89,3 |
| 35 to 39 years old | 8,0 | 97,3 |
| 40 years or more | 2,3 | 99,6 |
| ignored age | 0,4 | 100 |
Note that the accumulated attendance will reach 50% in the range of 25 to 29 years. Therefore, the letters a and b are wrong as they indicate values outside this range.
We will use the same procedure to find the 1999 median. The data are in the table below:
| age ranges | Frequency | Cumulative frequency |
| under 15 years | 0,7 | 0,7 |
| 15 to 19 years old | 20,8 | 21,5 |
| 20 to 24 years old | 30,8 | 52,3 |
| 25 to 29 years old | 23,3 | 75,6 |
| 30 to 34 years old | 14,4 | 90,0 |
| 35 to 39 years old | 6,7 | 96,7 |
| 40 years or more | 1,9 | 98,6 |
| ignored age | 1,4 | 100 |
In this situation, the median occurs in the range of 20 to 24 years. Therefore, the letter c is also wrong, as it presents an option that does not belong to the range.
Let's now calculate the average. This calculation is done by adding the products of the frequency by the average age of the interval and dividing the value found by the sum of the frequencies.
For the calculation, we will disregard the values related to the intervals "under 15 years old", "40 years old or more" and "ignored age".
Thus, taking the values of the graph for the year 2004, we have the following average:
Even if we had considered the extreme values, the average would be greater than 22 years. So the statement is true.
Just to confirm, let's calculate the average for the year 1999, using the same procedure as before:
As the value found is not less than 21 years, then this alternative will also be false.
Alternative: d) mean of mothers of children born in 2004 was greater than 22 years.
8) UPE - 2014
In a sports competition, five athletes are disputing the top three places in the long jump competition. The classification will be in descending order of the arithmetic average of points obtained by them, after three consecutive jumps in the test. In case of a tie, the criterion adopted will be the ascending order of the variance value. Each athlete's score is shown in the table below:

Based on the information presented, the first, second and third places in this competition were occupied, respectively, by the athletes
a) A; Ç; AND
b) B; D; AND
c) AND; D; B
d) B; D; Ç
and the; B; D
Let's start by calculating the arithmetic mean of each athlete:
Since everyone is tied, we will calculate the variance:
As the classification is done in descending order of variance, then the first place will be athlete A, followed by athlete C and E.
Alternative: a) A; Ç; AND
Gain more knowledge with the contents:
- Standard deviation
- Variance and Standard Deviation
- Probability Exercises