Cartographic projections are representations of the Earth's surface in a plane, with the use of meridians and parallels. There are different types of projections and each one of them highlights different aspects.
Since the Earth is a sphere, it is impossible to represent it perfectly on a plane. This means that all cartographic projections present deformations.
Depending on the type of map, it is possible to preserve some features and deform others. Among these features are: area, shape (angle) and size.
Types of cartographic projections
There are several different types of map projections. The main types of projections are classified in terms of projection surface or properties. Understand:
As for the projection surface
Projections can be classified according to the surfaces they are projected onto before being placed on the plane.
Cylindrical Projections
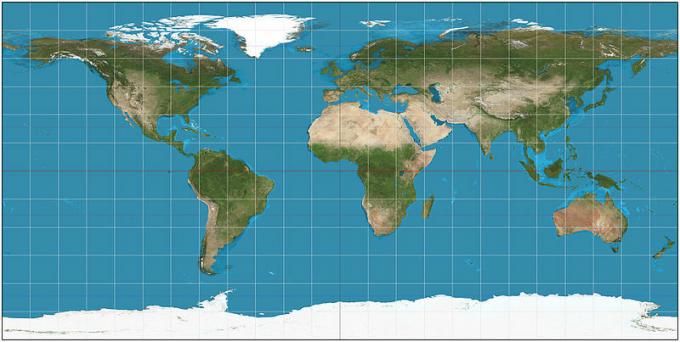
The cylindrical projection, developed by Gerardus Mercator in the 16th century, allows the full representation of planet earth.
It is called cylindrical because it is projected from the involvement of the terrestrial sphere in a cylinder, which when opened has its representation in the plane. In this type of projection, the meridians and parallels are perpendicular to each other.
The cylinder touches the Earth at the Equator, so in these regions the dimensions are more conserved. However, as it approaches the poles - zones of low latitude - the deformation increases.
See the meaning of latitude and longitude.
Conical Projections
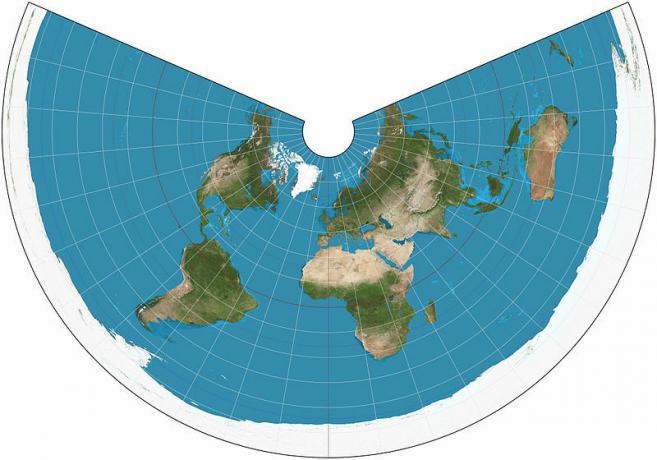
Conical projections are made from the enveloping planet Earth in a cone. This projection does not allow a full representation of the planet, as it is not possible to project both hemispheres at the same time.
In this type of projection, parallels are represented in semi-circles and meridians in incomplete radial systems. It is often used to represent countries at intermediate latitudes.
Plane or azimuth projections
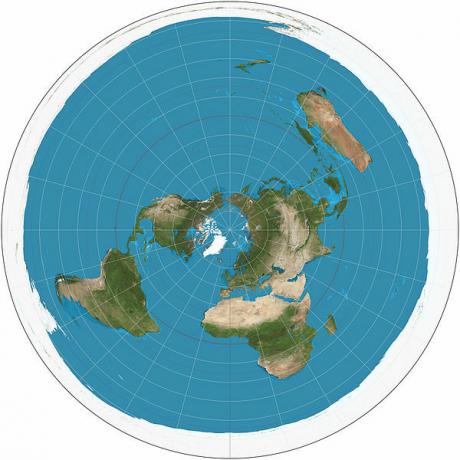
These projections are made from a flat surface that touches a point on the Earth. It is especially used to represent high-latitude zones such as the poles.
In plane projections, meridians are represented by a radial system of straight lines and parallels are represented by concentric circles.
As for the properties
The properties of maps are: areas, shapes (angles) and size. It is possible to preserve these properties in cartographic representations, but never all three simultaneously.
- Projection according to: there is no deformation in the shape of the continents - the angles are preserved. However, sizes and areas are compromised;
- Equivalent projection: the areas of the continents are unaltered, that is, they are equivalent. However, there are deformations in the shapes and angles;
- Equidistant projection: for some specific directions, the distances are kept, that is, there is no linear deformation in these directions. However, the areas and shapes are deformed;
- Aphylactic projection: aphylactic projections do not preserve any of the properties on the maps, but they minimize all deformations.
Main cartographic projections
There are several cartographic projections developed by different researchers and at different times in history. Here are some of the main ones:
Mercator projection
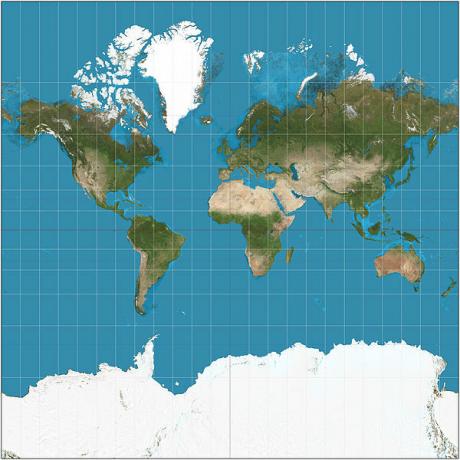
The Mercator projection is a conformal and cylindrical projection. This means that it represents the entire planet Earth and keep the shapes of the continents.
It was developed by Gerardus Mercator in 1569, in the 16th century. This was the period of great navigations and the colonization of the countries of the southern hemisphere by the countries of the northern hemisphere.
presents a vision Eurocentrist and northerner, as it places Europe at the center of the map and keeps the northern hemisphere always at the top.
Peters projection
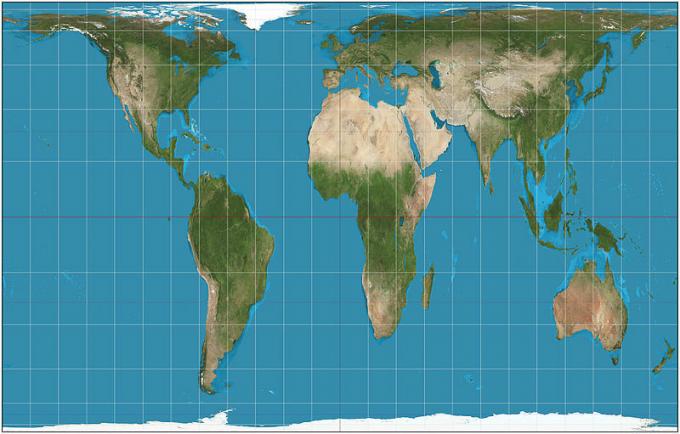
Peters' projection is equivalent and cylindrical. This means that it represents all continents and maintains their areas, but deforms angles and distances.
This projection was developed in 1973 by Arno Peters. As the African continent is placed in the center of the map, this projection is considered southern or third world.
Miller's projection
Developed by Osborn Miller in 1942, this projection is equivalent and cylindrical. It maintains areas but deforms angles and distances.

Robinson's projection
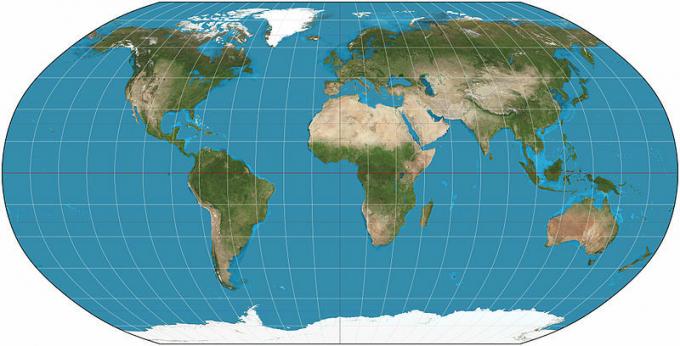
Robinson's projection was created by Arthur H. Robinson in 1963. This is an aphylactic projection, that is, no properties are conserved, however, the deformations are minimal.
UN symbol
One of the famous projections is the symbol used on the flag of the United Nations. This is a flat, equidistant projection and is projected from a pole.
This projection allows the visualization of all continents, however, it maintains a vision northerner, as it is designed with the Northern Hemisphere at the center.

Learn more about UN.

