
Histogram is a graph used for data analysis. This type of presentation makes it easier to observe the values.
It is basically formed by columns that indicate the frequency of data obtained in a survey or study.
Histograms are primarily used to demonstrate data gathered from statistics, such as gathering information about the population of a location.
But the use of histograms is not restricted to this type of presentation, they can also be used to expose other information, such as in evaluating a company's quality processes.
What parts of a histogram?
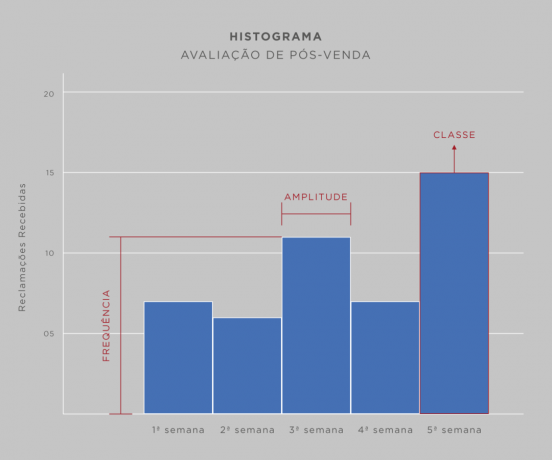
A histogram is made up of three elements: classes, amplitude and frequency.
- Classes: are the statistic values indicator bars, which represent both the minimum and maximum values (called class limits).
- Amplitude: represents the size of each of the classes (bars).
- Frequency: is the representation of the variation of the data sets.
See the parts of the histogram in this example of analyzing data about complaints a company receives after selling products.
Histogram Types
There are six types of histogram, which are classified by the way the bars are displayed: symmetrical, asymmetrical, cliff, two peaks, flat and isolated peak.
Symmetrical
This type of histogram has the highest frequency in the center and the lower ones are on the sides. It is typically used to represent average data obtained that are used to make comparisons with other survey information.

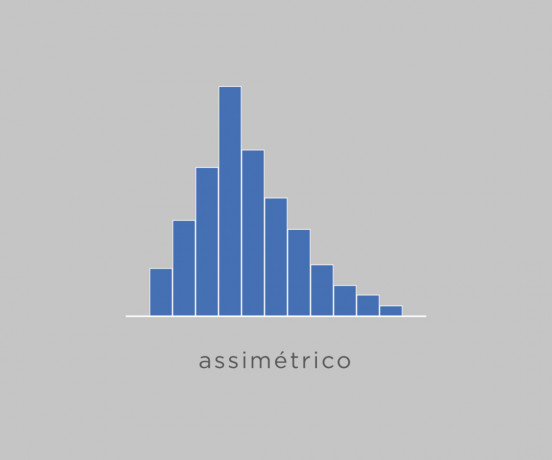
Asymmetric
In the asymmetric histogram there is a focal point, much higher than the others, which indicates a large variation between the data. The remaining bars are irregular and the asymmetry can be right or left.
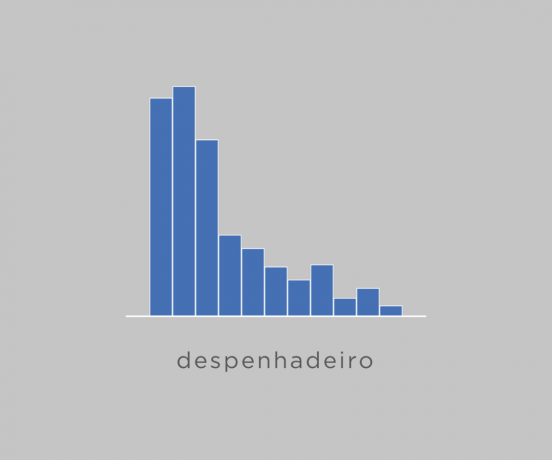
cliff
On the cliff the highest values are located at one end of histogram. This type is best used when some of the statistic data is not graphed.
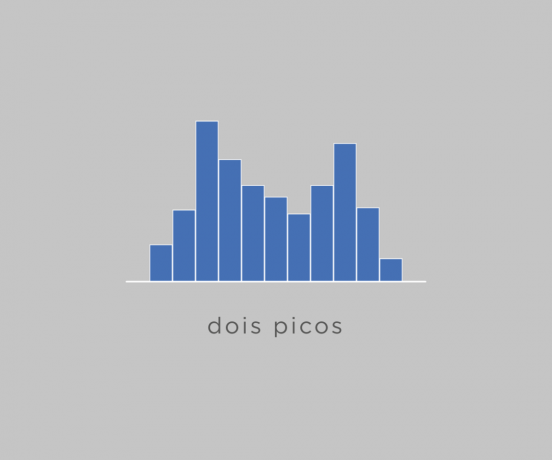
two peaks
In this type of histogram are represented two highest points at different points on the graph. This presentation indicates that there is more than one high frequency in the survey data. It is also known as a bimodal histogram.
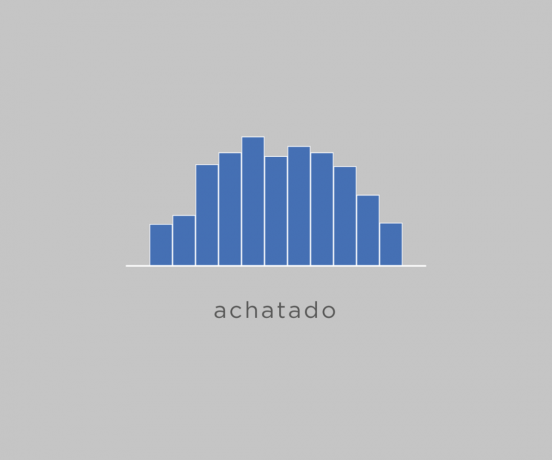
Flat
This type is called flat because all the bars are at similar sized frequencies. Unlike other types, there is no prominent point represented by a peak much larger than the others. It is also called a plateau histogram.
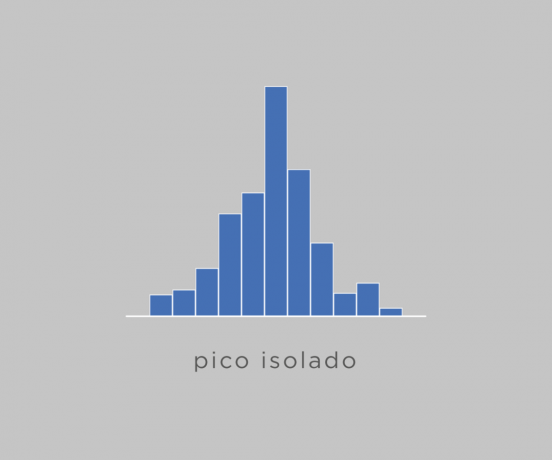
isolated peak
on the isolated peak one of the bars is very prominent in relation to the others. This type of presentation may indicate that there are failures in the statistic data collection.
How to make a histogram?
In order to make a histogram easily, follow these steps.
- Gather the dataset that will be used in the histogram and make a frequency table.
- Check the amplitude (difference) between the highest and lowest value found.
- Define how many classes (slashes) will be used according to the amount of data. Just divide the amplitude by the number of classes.
- Assemble the histogram using the bars and the data obtained (largest and smallest interval values).
Practical example: calculation of the sample of the age of employees of a company with 50 workers.
- Organize the data obtained in a frequency table:
Classes ages Number of employees 1 20-30 years 10 2 30-40 years 20 4 40-50 years 15 4 50-60 years old 3 5 60-70 years 2 - Find the range between the largest and smallest value. In this example the highest value is 70 years and the lowest is 20 years. The range found (70-20=50) is 50 years.
- The number of classes is defined according to the amplitude. In this case, for the amplitude of 50 we can use 5 classes (50/5 =10). Each class corresponds to 10 years.
- Assemble the histogram:

When to use a histogram?
This chart is suitable for displaying a large amount of statistical data, especially when the analysis is focused on situations like these:
- Follow up processes. Example: data collection histogram about a company's quality management processes to monitor the evolution of the procedures used.
- Compare data that represent extremes. Example: compare the difference between the number of sales of the most sold product by the company and the least sold.
Absolute and relative reference histogram: what does this mean?
Frequencies are sets of data analyzed in a histogram and they can be of two types: absolute or relative.
THE frequency absolute is the value that indicates how much data will be analyzed in each sample of the statistic.
THE relative frequency is the presentation of a percentage value. To obtain it, it is necessary to divide the absolute frequency by the number of items that are considered in the analyzed sample.
For example: the absolute frequency of 6 out of 48 samples is 12.5% (6/48 x 100% = 0.125 x 100 = 12.5%).
Also learn about other types of graphics.