ecological pyramids they are graphical representations of the trophic structure of an ecosystem. At the base of these representations, there are the producers, followed by the primary, secondary, tertiary consumers and so on (see the example below).

Note that the base of the pyramid always indicates the producing bodies
Ecological pyramids can be of three main types: pyramids of number, biomass and energy.
When we talk about pyramids of numbers, we are referring to the number of individuals involved in a food chain. In this graphical representation, it is indicated how many individuals exist in each trophic level.
Do not stop now... There's more after the advertising ;)
Suppose it takes 5,000 plants to feed 500 insects. These insects will serve as food for 25 birds, which, in turn, will be eaten by a single snake. In this example, you can see that the base has a greater number of individuals when compared to other trophic levels. When this happens, we say that the pyramid is direct.
Mind Map: Ecological Pyramids

*To download the mind map in PDF, Click here!
Sometimes, the base is not broad, as in cases where a single producer serves as food for a large number of primary consumers. It usually occurs when the producer is large, a tree, for example. In these cases, we have a pyramid inverted.

In an inverted pyramid, there are few producers and therefore a narrow base.
When we refer to a biomass pyramid, we are talking about the amount of organic matter available at each trophic level. Biomass is expressed in body mass per unit area, for example, kg/m2 or g/m2.
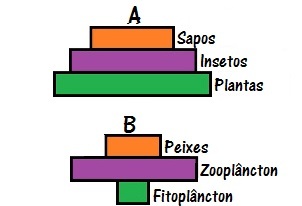
Typically, in these cases, there is a pyramid with a base larger than the apex. However, there are cases where it is inverted. This is the case of aquatic environments, where producers have a very short life, are small and multiply quickly, thus accumulating little matter.

In A, there is a pyramid of a terrestrial ecosystem, while in B, an aquatic environment.
Finally, we have the energy pyramid, which represents the amount of energy distributed at each trophic level. This type, unlike the others presented, cannot be represented inverted. It is always straightforward, as it represents the energy productivity in each ecosystem.
Producers always represent the highest energy level, and the other beings in the chain are dependent on this energy. It is concluded, therefore, that part of the producers' energy will be transmitted to the herbivores and only part of their energy will pass to the carnivores. Thus, smaller food chains have a greater use of energy. We represent the amount of energy available at each trophic level per Kcal/m2.year.

Producers represent the highest energy level
By Ma. Vanessa dos Santos
Would you like to reference this text in a school or academic work? Look:
SANTOS, Vanessa Sardinha dos. "Ecological Pyramids"; Brazil School. Available in: https://brasilescola.uol.com.br/biologia/piramides-ecologicas.htm. Accessed on June 27, 2021.


