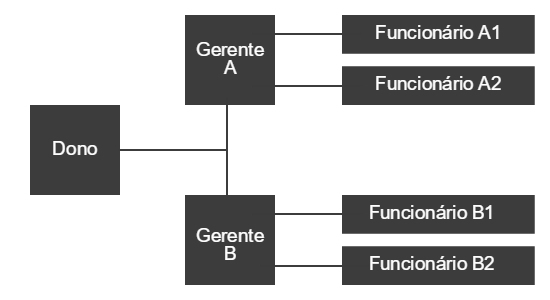
Organization chart is a graphic that visually represents the organizational structure of an institution or company. The main purpose of this structural model is to present the hierarchy and relationships between the different sectors of the organization.
O business organization chart can be presented in several ways, being the model vertical one of the most popular. In this case, each agency of the institution is represented with the respective responsible for the sectors, organized by hierarchical form, with the highest posts located at the top of the structure, followed by their respective subordinates.
Example:

The main purpose of the organization chart is to help clarify doubts about the organization of the company, whether for the company's own members, for partners, suppliers or customers.
The first organization charts would have appeared in the mid-19th century, authored by the railway engineer Daniel Craig McCallum, considered one of the pioneers to organize the modern principles of management.
How to make an organization chart
A well done organization chart should be of easy interpretation, clearly organized so that each agency or employee, for example, knows their respective functions and to whom they should report. Organization charts must also be flexible, as they can be changed at any time. They are not permanent structures.
Currently, some organizational restructuring techniques, such as "downsizing”, for example, are promoting the “shortening” of business organization charts, eliminating sectors and hierarchical levels, eliminating bureaucratic processes, in addition to facilitating and streamlining communication internal.
Learn more about the meaning of Downsizing.
Types of Organizational Charts
Functional or vertical organization chart: as mentioned earlier, in the vertical model (also known as functional) the most important positions are at the top of the graph and the hierarchy is from top to bottom. The expression is used "functional organization chart" when the division and hierarchization refers to functions, if the chart shows the sectors and areas, for example, it is common to refer to the organization chart as "classic vertical".
Horizontal Organizational Chart: it is the same as the vertical model, but with the difference that it has the most important hierarchical nuclei on the left side, following a horizontal line towards the right side.

There are still other types of organization charts that are suitable for different organizational representations, such as: bar organization chart, circular (or radial) organization charts, linear responsibility organization chart, among others.
Organization chart and flowchart
The organization chart consists of the representation of the company's organization in graphic form. With the organizational chart, it is possible to identify flaws in the hierarchical or communicational levels between the different sectors of the company.
The flowchart, on the other hand, consists of the representation of the steps of a process, that is, a simple and uncomplicated way of explaining a system or transmitting information through the use of sequential images.
See too The Types of Search.
