study the sign of a function is to determine what real values of x the function is for. positive, negative or null. The best way to analyze the signal of a function is by graphic, as it allows us a broader assessment of the situation. Let's analyze the graphs of the functions below, according to their formation law.
Note: To build a graph of a 2nd degree function, we need to determine the number of roots of the function, and if the parable it has a concavity facing up or down.
∆ = 0, a real root.
∆ > 0, two real and distinct roots
∆ < 0, no real root.
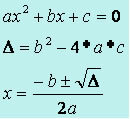
To determine the value of ∆ and the values of the roots, use Bhaskara's method:
Coefficient a > 0, parabola with concavity facing up
Coefficient a < 0, parabola with the concavity facing downwards
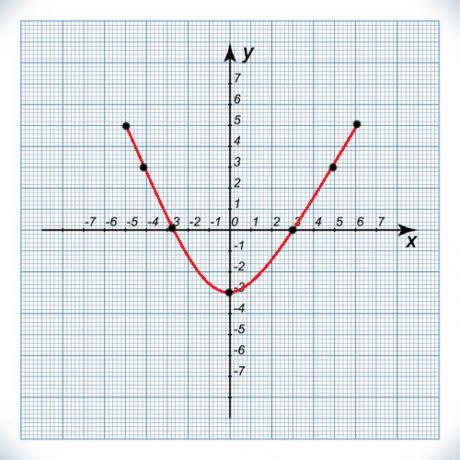
1st Example:
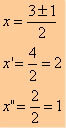
y = x² - 3x + 2
x² - 3x + 2 = 0
Applying Bhaskara:
∆ = (−3)² – 4 * 1 * 2
∆ = 9 – 8
∆ = 1
The parabola has an upward concavity because a > 0 and has two distinct real roots.
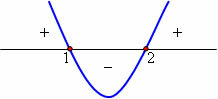
Chart analysis
x < 1 or x > 2, y > 0
Values between 1 and 2, y < 0
x = 1 and x = 2, y = 0
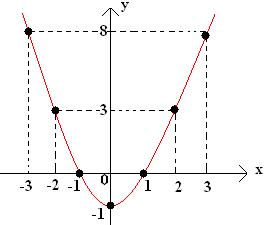
2nd Example:
y = x² + 8x + 16
x² + 8x + 16 = 0
Applying Bhaskara:
∆ = 8² – 4 * 1 * 16
∆ = 64 – 64
∆ = 0

The parabola has an upward concavity because a > 0 and a single real root.
Do not stop now... There's more after the advertising ;)
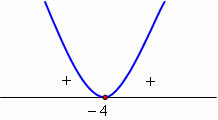
Chart analysis:
x = –4, y = 0
x ≠ -4, y > 0
3rd Example:
y = 3x² - 2x + 1
3x² - 2x + 1 = 0
Applying Bhaskara:
∆ = (–2)² – 4 * 3 * 1
∆ = 4 – 12
∆ = – 8
The parabola has an upward concavity because of a > 0, but it has no real roots because ∆ < 0.
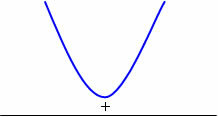
Chart analysis
The function will be positive for any real value of x.
4th Example:
y = – 2x² – 5x + 3
– 2x² – 5x + 3 = 0
Applying Bhaskara:
∆ = (–5)² – 4 * (–2) * 3
∆ = 25 + 24
∆ = 49
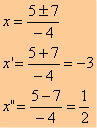
The parabola has a downward-facing concavity in the face of a< 0 and two distinct real roots.
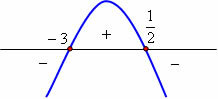
Chart analysis:
x < –3 or x > 1/2, y < 0
Values between – 3 and 1/2, y > 0
x = –3 and x = 1/2, y = 0
5th Example:
y = –x² + 12x – 36
–x² + 12x – 36 = 0
Applying Bhaskara:
∆ = 12² – 4 * (–1) * (–36)
∆ = 144 – 144
∆ = 0
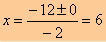
The parabola has a downward-facing concavity due to a < 0 and a single real root.

Chart analysis:
x = 6, y = 0
x ≠ 6, y < 0
by Mark Noah
Graduated in Mathematics
High School Function - Roles - Math - Brazil School
Would you like to reference this text in a school or academic work? Look:
SILVA, Marcos Noé Pedro da. "Signs of 2nd Degree function"; Brazil School. Available in: https://brasilescola.uol.com.br/matematica/sinais.htm. Accessed on June 28, 2021.
Math

Second Degree Function, Function, Function Graph, Parabola, Concavity, Parabola Down, Concavity Up, Graphing, Coefficient a Positive, Coefficient a Negative.
Function, Function characteristic, Superjective function, Injector function, Bijector function, Image of a function, Image, image of a function, against domain, Counter domain of a function.