The parable is the representation of a 2nd degree function. In its construction we observed some important points such as the intersections with the x and y axes and the coordinate points of its vertex.
When solving a 2nd degree equation using Bhaskara's method, we will have three possible results, all depending on the value of the discriminant ∆. Watch:
∆ > 0: two different real roots.
∆ = 0: one real root or two equal real roots.
∆ < 0: no real root.
These conditions interfere in the construction of graphs of the 2nd degree function. For example, the graph of the function y = ax² + bx + c, has the following characteristics according to the value of the discriminant:
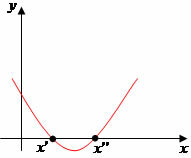
∆ > 0: the parabola will cut the x-axis at two points.
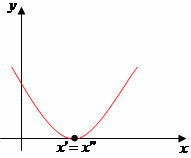
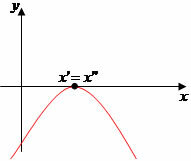
∆ = 0: the parabola will cut the x-axis at only one point.
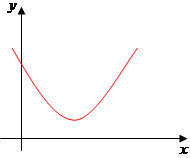
∆ < 0: the parabola will not cut the x-axis.
At this moment we must take into account the concavity of the parabola, that is, when the coefficient a > 0: concavity upwards, and a < 0: concavity downwards.
According to the existing conditions of a 2nd degree function, we have the following graphs:
a > 0, we have the following graph possibilities:
∆ > 0
∆ = 0
∆ < 0
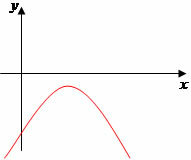
a < 0, we have the following graph possibilities:
∆ > 0

∆ = 0
∆ < 0
Vertices of the Parable

a > 0, minimum value

a < 0, maximum value

by Mark Noah
Graduated in Mathematics
Brazil School Team
Equation - Math - Brazil School
Source: Brazil School - https://brasilescola.uol.com.br/matematica/pontos-notaveis-uma-parabola.htm

