Dynamic equilibrium or chemical equilibrium of a reaction occurs when the forward and reverse reactions occur simultaneously. These so-called reversible systems are represented by arrows in both directions:  or
or  . An example of a reversible reaction is cited in the image above, between iodine gas and hydrogen gas.
At the beginning of the reaction, the amount of reactants is maximum and that of products is zero. However, the reactants react with each other, decreasing their concentration and increasing those of the formed products. The rate of development of the direct reaction is also decreasing.
As the concentration of the products increases, the inverse reaction starts and the reactants are formed again; the rate of development of the inverse reaction increases as well.
Upon reaching chemical equilibrium, at constant temperature, the rates of development of the forward and reverse reactions are equal.
Alldirect = All inverse
Rates are the same, but concentrations are not. The concentrations of reagents and products will hardly be the same. Only in rare cases does this occur. In most cases the concentration of reagents will be higher than that of products or vice versa.
Thus, we have three possible ways to graphically represent the development rates of direct and inverse reactions, relating the concentrations of reactants and products over the time. Let's look at each case:
1st case: Equal concentrations:
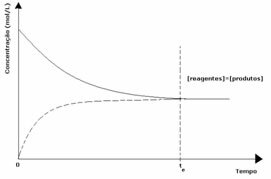
As seen in the graph, at time tand the forward and reverse reactions are the same, in which case the concentrations of reactants and products are the same. Thus, the balance is not shifted to either side, the intensity of both reactions is the same, as expressed below:

2nd case: Concentration of reagents greater than concentration of products:
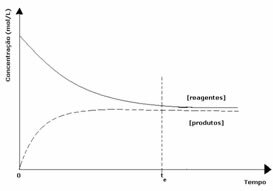
In this case, it is observed that when reaching equilibrium, the concentration of reagents is greater than that of the products. Thus, it is concluded that if there is more reactant, the inverse reaction is occurring with greater intensity. The reaction is shifted to the left:
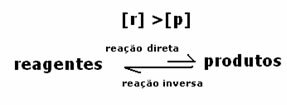
3rd case: Concentration of products greater than that of reagents:
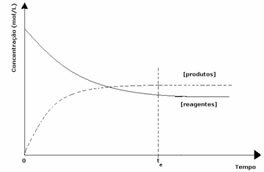
Since at equilibrium the concentration of products is greater, this means that the reaction is shifted to the right, because the direct reaction (with formation of products) occurs with greater intensity.

What will indicate whether the reaction tends to the right or to the left will be the equilibrium constant K, which only depends on the temperature.
By Jennifer Fogaça
Graduated in Chemistry
Brazil School Team
Source: Brazil School - https://brasilescola.uol.com.br/quimica/estudo-grafico-equilibrio-quimico.htm

