You MUV graphics are resources used to study the position, velocity or acceleration of a body that moves with constant acceleration for a certain period of time. They are usually made with the time variable along the horizontal axis (abscissa axis).
See too: MUV hourly functions
MUV graph: speed vs. time
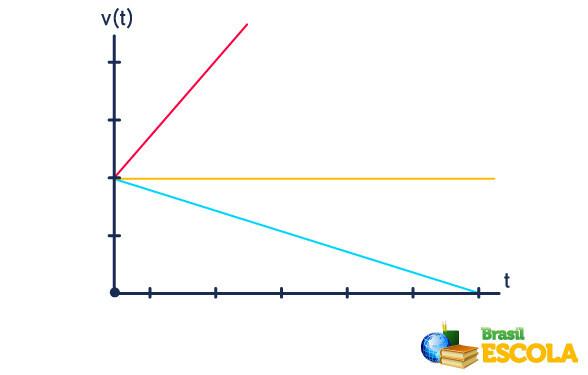
The graph of velocity versus time for uniformly varied rectilinear motion relates to speed of a rover, usually in meters per second (m/s), per instant of time, in seconds (s). For the case of MUV, this graph is always a straight, which can be tilted up or down, in cases where the movement is accelerated or retarded, respectively.
THE straight line can still be parallel to the horizontal axis, in which case the velocity remains constant for a certain period of time. Also, in this graph, the slope of the line (which can be calculated by the tangent) represents the acceleration of the rover.
Attention! Before proceeding with the interpretation of the MUV graphics, we suggest that you review some of the content by accessing our specific article: Muniformly varied movement.
The following figure shows these three situations illustrated in a graph of velocity versus time v (t). Watch:

- 1st case [red line] – accelerated movement
- 2nd case [blue line] – delayed movement
- 3rd case[yellow straight] – uniform movement
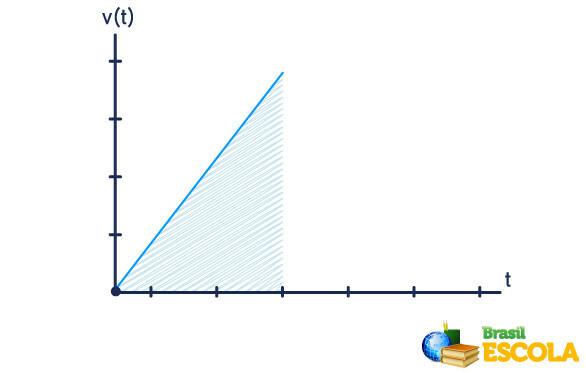
From the graph of v (t), it is possible to determine the space traveled by a particle moving in MRUV. To do so, we calculate the area below the graph between the desired time instants. Watch:

See too: Everything you need to know about MEchanics in Enem
MUV graph: position x time
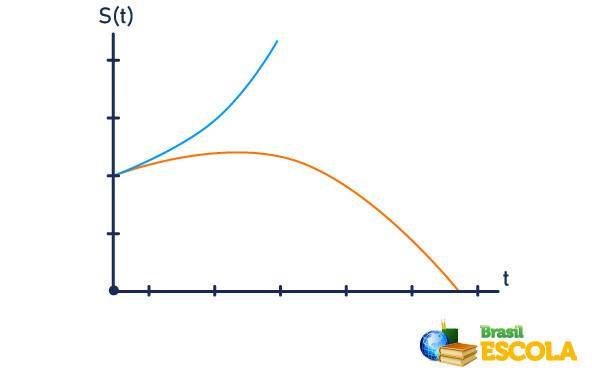
The position versus time graphs for the MUV are represented by parables, since the functions of the position in the MUV are 2nd degree equations. An important aspect of these position charts is the concavity of the parables.
- If the concavity is facing up, the movement is accelerated.
- If the concavity is down, the movement is retarded.
Also, it is important to notice at which point the curve crosses the vertical axis. This information is used to determine the starting position of the rover.

MUV graphics: acceleration vs. time
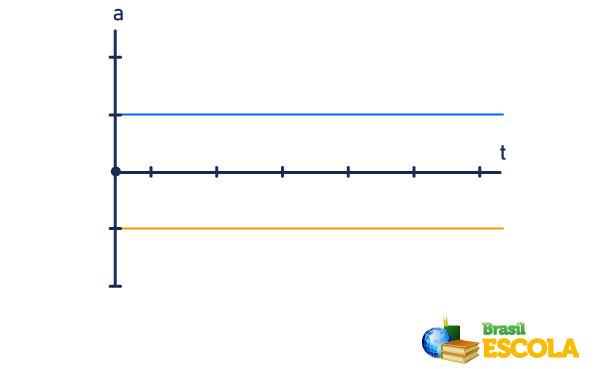
The MUV graphs relating acceleration to time are quite simple: it's about straight lines parallel to the horizontal axis. In the case where the movement is accelerated, the line is drawn above the axis of the abscissa; otherwise, it is drawn below that same axis.

See too: Torricelli Equation – formula and solved exercises
Solved exercises on MUV graphics
Question 1 — In a graph of velocity versus time, for the case where a rover moves with constant acceleration, the area below the line represents:
a) mobile acceleration.
b) moving the furniture.
c) the final position of the mobile.
d) the variation of the mobile acceleration.
Resolution:
The area below the straight line in the velocity graph represents the displacement of the rover, so the correct alternative is letter B.
Question 2 — On a graph of velocity versus time, for uniformly varied motion, the slope of the straight line indicates:
a) the space covered by the furniture.
b) moving the furniture.
c) mobile acceleration.
d) the speed of the mobile.
Resolution: letter C.
By Rafael Hellerbrock
Physics teacher
Source: Brazil School - https://brasilescola.uol.com.br/fisica/graficos-movimento-uniformemente-variado.htm

