The structure of an atom is complex and full of details. For many years, several scientists around the world dedicated part of their lives to studying the constitution of an atom, creating models and theories. Thanks to this, we currently have knowledge about several details of the atomic constitution:
A nucleus with protons and neutrons – proposed by Rutherford and Chadwick, respectively;
Energy levels or electronic layers – proposed by Bohr;
Energy sub-levels (energy level sub-regions) - proposed by Sommerfeld;
Atomic orbitals (most likely place to find an electron) – proposed by Erwin Schrödinger.
Regions around the nucleus (levels, sublevels and orbitals) have great relevance, because, through knowledge of these areas, it was possible to know the phenomenon of fluorescence, phosphorescence, the way a chemical bond occurs and some physical behavior of matter (magnetism).
See how the regions of the atom are organized:
█ levels
The atom has a total of seven levels, represented by the letters K, L, M, N, O, P, Q, each with a specific amount of energy.
█ sublevels
Each level has a specific amount of sublevels, which are represented by just four letters: s, p, d, f.
K - 1 sublevel(s)
L - 2 sublevels (s, p)
M - 3 sublevels (s, p, d)
N - 4 sublevels (s, p, d, f)
O- 4 sublevels (s, p, d, f)
P - 3 sublevels (s, p, d)
Q - 2 sublevels (s, p)
█ Orbitals
Each sublevel presents a different amount of orbitals:
s = 1orbital
p = 3orbitals
d = 5orbitals
f =7orbitals
Observation: In each orbital, we can find at most two electrons. Thus, the maximum number of electrons in a sublevel is:
s = 2electrons
p = 6electrons
d = 10electrons
f = 14electrons
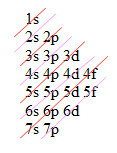
Knowing all this information, the American chemist Linus Carl Pauling developed a tool to distribute the electrons of an atom more practically on paper. This important tool was called Linus Pauling diagram. In this diagram, we only have levels and sublevels. See an outline:

the strokes in pink and orange they establish an order of energy that runs through the entire diagram. This order starts with the dash that passes in 1s and follows a diagonal course until reaching 7p. Each diagonal line that follows indicates sublevels of more energy than those of the previous line. The sublevel further down the same diagonal line always has more energy than the previous one. Thus:
2s have more energy that 1s (present in different diagonal strokes);
4p has more energy than 3d (present in the same diagonal stroke).
To perform the distribution of electrons through the Pauling diagram, it is necessary to have the number of electrons of any atom, follow the diagonal lines and respect the maximum number of electrons in each sublevel. See some examples:
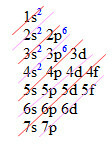
— Electronic distribution from Z = 20 (20 electrons)

Electronic distribution of an atom with 20 electrons
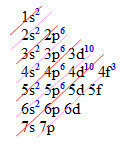
— Electronic distribution from Z = 59 (59 electrons)

Electronic distribution of an atom with 59 electrons
Like Linus Pauling diagram, it is possible to carry out the following tasks:
Distribute all electrons in an atom;
Predict the lowest and highest energy regions of the atom (electrons are distributed in the atom in such a way as to occupy areas of lower energy always);
Predict the number of levels of an atom from its atomic number (Z);
Predict the classification of any atom from its atomic number (Z).
Establish the number of bonds the atom must make to achieve stability.
¹ Image credits: Shutterstock / catwalker
By Me. Diogo Lopes Dias
Source: Brazil School - https://brasilescola.uol.com.br/quimica/diagrama-linus-pauling.htm


