correlation means a similarity or relationship between two things, people or ideas. It is a similarity or equivalence that exists between two different hypotheses, situations or objects.
In the field of statistics and mathematics, correlation refers to a measure between two or more variables that are related.
The term correlation is a feminine noun that comes from Latin correlate.
The word correlation can be replaced by synonyms such as: relation, equivalence, nexus, correspondence, analogy and connection.
Correlation Coefficient
In statistics the Pearson's correlation coefficient (r), which is also called the product-momentum correlation coefficient, measures the relationship that exists between two variables within the same metric scale.
The function of the correlation coefficient is to determine the strength of the relationship that exists between sets of known data or information.
The value of the correlation coefficient can vary between -1 and 1 and the result obtained defines whether the correlation is negative or positive.
To interpret the coefficient, it is necessary to know that 1 means that the correlation between the variables is perfect positive and -1 means it is perfect negative. If the coefficient is equal to 0 it means that the variables do not depend on each other.
In statistics there is also the Spearman correlation coefficient, named after the statistician Charles Spearman. The function of this coefficient is to measure the intensity of the relationship between two variables, whether they are linear or not.
The Spearman correlation serves to assess whether the intensity of the relationship between the two analyzed variables can be measured by a monotonous function (mathematical function that preserves or inverts the order relation initial).
Calculation of Pearson's correlation coefficient
Method 1) Calculation of Pearson's correlation coefficient using covariance and standard deviation.

Where
sXYis the covariance;
sx and syrepresent the standard deviation, respectively, of the x and y variables.
In this case, the calculation involves first finding the covariance between the variables, and the standard deviation of each one of them. Then divide the covariance by multiplying the standard deviations.
Often, the statement already provides either the standard deviations of the variables, or the covariance between them, just by applying the formula.
Method 2) Calculation of Pearson's correlation coefficient with raw data (no covariance or standard deviation).
With this method, the most direct formula is as follows:

For example, assuming we have data with n=6 observations of two variables: glucose level (y) and age (x), the calculation follows these steps:
Step 1) Build the table with existing data: i, x, y, and add blank columns for xy, x² and y²:
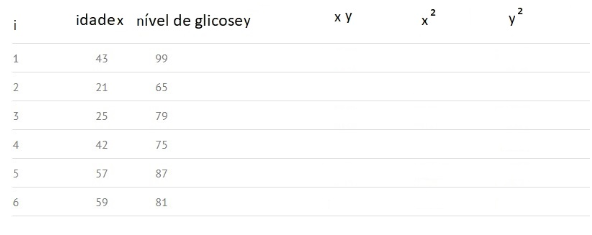
Step 2: Multiply x and y to fill the “xy” column. For example, in line 1 we will have: x1y1 = 43 × 99 = 4257.

Step 3: Square the values in column x, and record the results in column x². For example, in the first line we will have x12 = 43 × 43 = 1849.

Step 4: Do the same as in Step 3, now using column y and record the square of your values in column y². For example, in the first line we will have: y12 = 99 × 99 = 9801.

Step 5: Get the sum of all column numbers and place the result in the column footer. For example, the sum of column Age X equals 43+21+25+42+57+59 = 247.

Step 6: Use the above formula to obtain the correlation coefficient:

So we have:

Calculation of Spearman's Correlation Coefficient
The calculation of Spearman's correlation coefficient is a little different. For that, we need to organize our data in the following table:
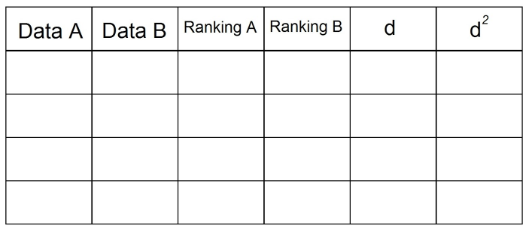
1. Having in the statement 2 pairs of data, we must introduce them in the table. For example:
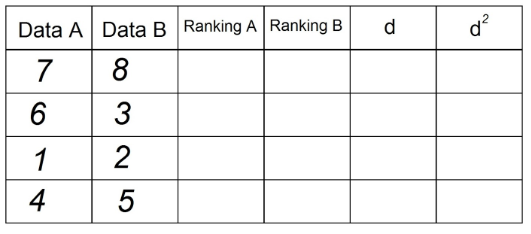
2. In the "Ranking A" column, we will sort the observations that are in "Date A" ascending, being “1” the lowest value in the column, and n (total number of observations) the highest value in the “Date” column THE". In our example it is:
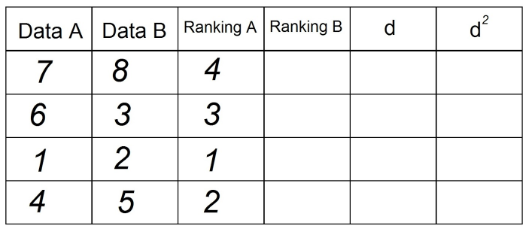
3. We do the same to obtain the “Ranking B” column, using now the observations in the “Data B” column:
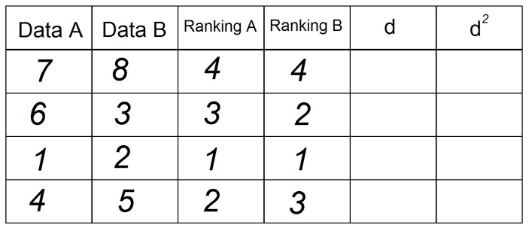
4. In column “d” we put the difference between the two Rankings (A - B). Here the signal doesn't matter.

5. Square each of the values in column "d" and record in column d²:
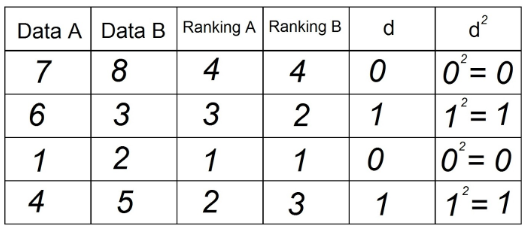
6. Sum all data from column "d²". This value is Σd². In our example Σd² = 0+1+0+1 = 2
7. Now we use Spearman's formula:
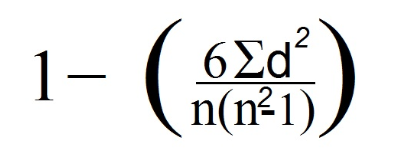
In our case, n is equal to 4, as we look at the number of data lines (which corresponds to the number of observations).
8. Finally, we replaced the data in the previous formula:

linear regression
Linear regression is a formula used to estimate the possible value of a variable (y) when the values of other variables (x) are known. The value of "x" is the independent or explanatory variable and "y" is the dependent variable or response.
Linear regression is used to see how the value of "y" can vary as a function of the variable "x". The line containing the variance check values is called the linear regression line.
If the explanatory variable "x" has a single value, the regression will be called simple linear regression.


