We will see in this text how a chart of change of physical state to any pure substance, how to interpret this type of diagram and how the graph of mixtures is represented.
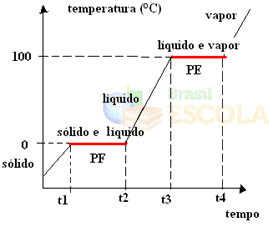
To do this, let's consider the example of water. Imagine that we take a glass of ice at a temperature of –10 ºC and start a heating process, under a pressure of 1 atm. As the temperature increases, going from -10 ºC to -9 ºC, to -8 ºC and so on, the ice will remain in a solid state until it reaches a temperature of 0 ºC.
At this point, it starts to change into a liquid state, that is, fusion begins to take place. The temperature will not continue to rise as before, but will remain constant at 0°C until all the ice has melted:

After melting all the solid, the temperature of the system will continue to increase until reaching a temperature of 100°C. At this temperature, the water that was in the liquid state will start to change to the vapor state, that is, it will boil.
Just as it happened in the fusion point, at the boiling point, the temperature will also remain constant until all the liquid turns to vapour. After that, if we keep heating the system, the temperature will continue to rise:

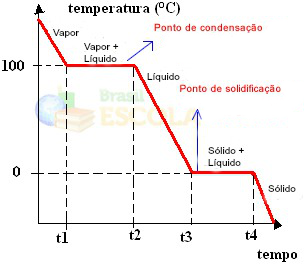
Ready! This is the graph or diagram that represents the change in the physical state of water or its heating curve. If it were the inverse process, we would have the following water cooling curve:

A very important aspect of these graphs is that they are formed by two levels, that is, there are two points where the temperature remains constant for a while. This always occurs in the change of state of a pure substance. The only difference is the melting and boiling point values.
Do not stop now... There's more after the advertising ;)
Oxygen, for example, unlike water, is not a liquid, but a gas at room temperature (about 20ºC). This is because its melting point at sea level is -223.0 °C and its boiling point is -183.0 °C. See your physical state change chart:

Common mix graphics
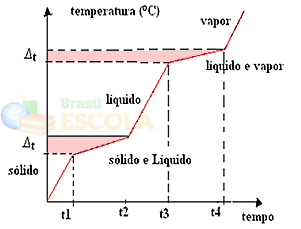
If we are heating or cooling a mixture, the melting point and boiling point will not have determined and constant values, that is, the two levels observed in the graphs will not be formed above.
Changes in physical states will occur over temperature ranges rather than a fixed amount. The melting point, for example, will start at a given temperature and end at another, and the same will happen with the boiling point, as shown in the graph below:

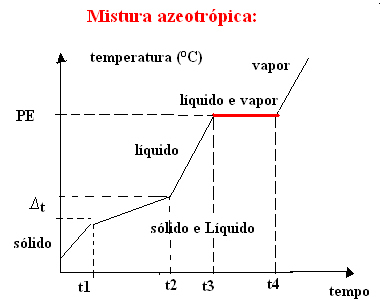
Two exceptions are eutectic and azeotropic mixtures. See what happens to them:
a) Eutectic mixture
The eutectic mixture behaves as if it were a pure substance during the fusion, that is, at that point, the temperature remains constant from the beginning to the end of the change of state of aggregation.

b) azeotropic mixture
The azeotropic mixture behaves like a pure substance during boiling, that is, at this point, the temperature remains constant from the beginning to the end of the change in aggregation state.

By Jennifer Fogaça
Graduated in Chemistry
Would you like to reference this text in a school or academic work? Look:
FOGAÇA, Jennifer Rocha Vargas. "Charts of Physical State Changes"; Brazil School. Available in: https://brasilescola.uol.com.br/quimica/graficos-mudanca-estado-fisico.htm. Accessed on June 28, 2021.


