Maps and graphs are two tools used in various professions, as they are important elements of orientation and location.
Cartographic Conventions
Cartographers, who are professionals responsible for drawing up maps, have developed a series of codes or conventions internationally accepted, as a way to standardize the use of these resources around the world, thus facilitating the work.
Symbols (figures, drawings, colors, lines or hatches) were also created, which are extremely important in the interpretation of maps, from which it becomes possible to reproduce the characteristics of the desired study area, these symbols are called subtitle.
Maps
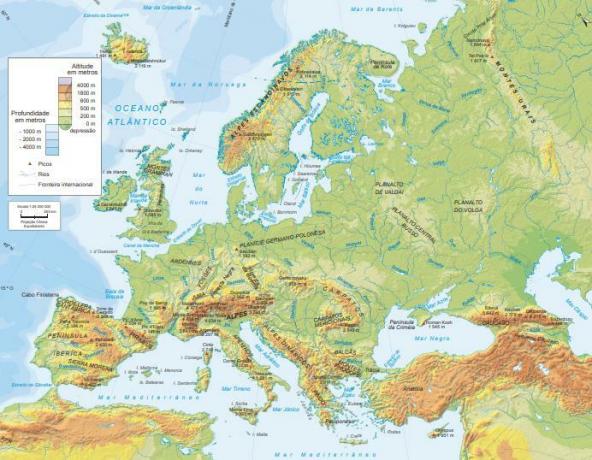
Maps are graphical representations of the real, sketched in imaginary lines, usually produced on paper. Maps are classified into physical, economic and historical maps.

• physical maps: These are maps that represent natural factors, such as vegetation, climate, relief, hydrography, etc.

• Political Maps: These are maps that represent borders between countries or sharp divisions between states (eg. Goiás, Rio de Janeiro etc), delimiting the territory in which sovereignty is exercised.
Do not stop now... There's more after the advertising ;)

• historical maps: These are maps that represent events from the past. Ex Treaty of Tordesillas.
Plan, Planisphere and Geographic Globe

plants: They are produced on a large scale. Ex. 1cm/30m, 1cm on paper corresponds to 30 m from the real.

planisphere: When you want to represent a large expanse of land.

geographic globe: Represents the shape of the Earth's surface with the greatest fidelity.
Maps can be interpreted according to what is expressed in them, through the elements that compose them (title, legend, scale, orientation and font).
Graphics
These are visual resources used for reading information about natural, social and economic aspects and processes, the graphic represents the information through geometric shapes accurately, the charts are classified into Column chart, pie chart and of line.
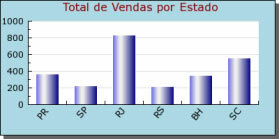
• Column chart

• Pie chart
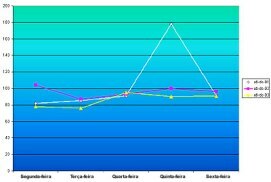
• line graph
Eduardo de Freitas
Graduated in Geography
Would you like to reference this text in a school or academic work? Look:
FREITAS, Eduardo de. "Maps and Graphs"; Brazil School. Available in: https://brasilescola.uol.com.br/geografia/os-mapas-os-graficos.htm. Accessed on June 28, 2021.