We define a function as the relationship between two quantities represented by x and y. In the case of a 1st degree function, its formation law has the following characteristic: y = ax + b or f (x) = ax + b, where coefficients a and b belong to real numbers and differ from zero. This function model has a graphic representation of a straight, therefore, the relationships between the domain and image values increase or decrease according to the value of the coefficient a. If the coefficient has signal positive, the function is growing, and if it has a negative sign, the function is decreasing.
Ascending function: a > 0

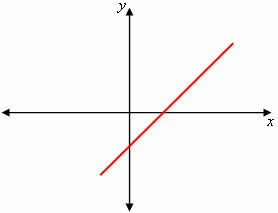
At increasing function, as x values increase, y values also increase; or, as x values decrease, y values decrease. Look at the table of points and the graph of the function y = 2x - 1.
x |
y |
-2 |
-5 |
-1 |
-3 |
0 |
-1 |
1 |
1 |
2 |
3 |

Descending function: to < 0

In the case of descending function, as x values increase, y values decrease; or, as x values decrease, y values increase. See function table and graph y = – 2x – 1.
x |
y |
-2 |
3 |
-1 |
1 |
0 |
-1 |
1 |
-3 |
2 |
-5 |

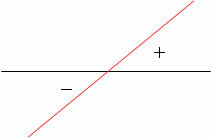
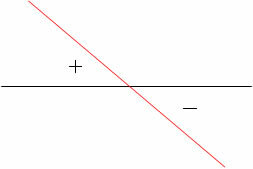
According to the analyzes made on the increasing and decreasing functions of the 1st degree, we can relate their graphs to the signals. Look:
Signs of the 1st degree increasing function:

Signs of the 1st degree decreasing function:

Example:
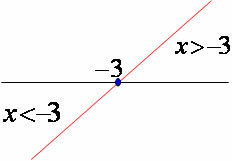
Determine the signs of the function y = 3x + 9.
Making y = 0, calculate the root of the function:
3x + 9 = 0
3x = –9
x = -9/3
x = – 3
The function has the coefficient a = 3, in this case, it is greater than zero, therefore, the function is increasing.

by Mark Noah
Graduated in Mathematics
Source: Brazil School - https://brasilescola.uol.com.br/matematica/estudo-dos-sinais.htm

