The study of graphics is required in almost all situations involving physics. Therefore, we can say that the graph serves to visualize the behavior of physical quantities in an easy and fast way. Through the graphs we can see how a physical quantity is changing as a function of another physical quantity. In this article we will do a general analysis about the graphics.
First Example:
The graph above indicates the position, as a function of time, of a moving piece of furniture. He gives the abscissa in every instant.
a) Read the time values corresponding to the positions on the graph: s = 3 m; s = 2m; s = 1m; s = 0m.
b) What happens at time t = 4 s? Where is the furniture?
c) Calculate the scalar velocity v.
d) Write the hourly equation of the abscissa.
Resolution:
Letter a)
s=3 m → t=0 is the initial space (s_0=3 m)
s=2 m → t=1 s
s=1 m → t=2 s
s=0 m → t=3 s (mobile passes through the origin)
Letter B)
At t = 4 s, the abscissa is negative: s = -1m.
Letter C)
Just choose any two points:
s1=2 m ↔ t1=1 s
s2=1 m ↔ t2=2 s
Calculating scalar velocity:


v= 1m/s
Letter D)
To solve this question, just consider the value of the initial space and speed found in item (c), as follows:
Do not stop now... There's more after the advertising ;)
s_0= 3 m and v= -1 m/s
s= s_0+ v.t
s=3-1t
Second example:

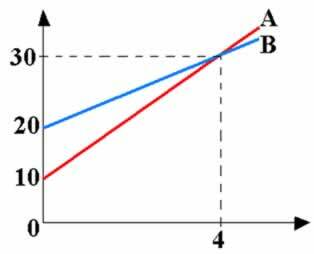
The graph above indicates the speed as a function of time of two mobiles moving in a straight path, in the same direction. It is known that they started at time t = 0, from the same place. Determine the distance between A and B at time t = 4 s.
Resolution:
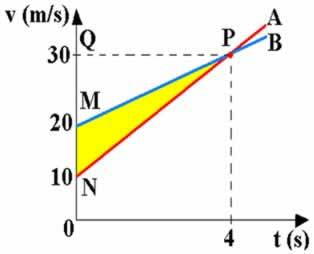
In the hourly scalar velocity diagram you can calculate the distance traveled from the graph area. Thus, the distance covered by A corresponds to the area of the smallest trapezius; and the distance covered by B, to the area of the largest trapeze, until time t = 4 s. The distance (d) that separates them, in a time of 4 s, will be given by the difference between the two areas. From the figure below we notice that this difference corresponds to the area of the MNP triangle (yellow area in the graph).

From the figure above we have:
base: MN=10 height: QP=4
d=area of triangle MNP


d=20 m
By Domitiano Marques
Graduated in Physics
Would you like to reference this text in a school or academic work? Look:
SILVA, Domitiano Correa Marques da. "Practicing Graphic Representations"; Brazil School. Available in: https://brasilescola.uol.com.br/fisica/praticando-as-representacoes-graficas.htm. Accessed on June 27, 2021.


