O Gini Index - also known as Gini Coefficient – is a mathematical instrument used to measure social inequality in a given country, federative unit or municipality. Its importance is effective in view of the limitations that other indexes - such as the GDP and the income per capita - have to measure the distribution of wealth.
The Gini coefficient is named after its developer, the Italian mathematician. Conrado Gini, who created this calculation in 1912 with the concern of measuring how much a given place can be socially and economically egalitarian or unequal.
The measurement of the Gini index obeys a scale that goes from 0 (when there is no inequality) a 1 (with maximum inequality), which are two numbers whose values will never be reached anywhere, as they represent ideal extremes. In this sense, the smaller the numerical value of the Gini coefficient, the less unequal a country or locality is.
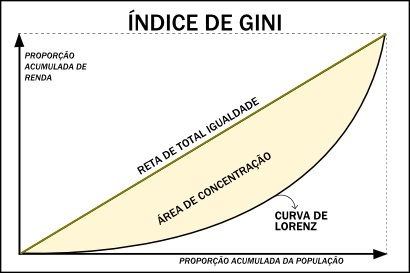
Graphically, the representation of the Gini Index is performed from the call Lorenz curve, which shows the accumulated proportion of income as a function of the accumulated proportion of the population. Observing the graph below, it is considered that a straight line would represent perfect equality and that any point of its ordinates corresponds to an equal value on the abscissa axis.

Representation of the Gini Index Graph
Therefore, the Gini index graph reveals the income inequality index of a given location from the Lorenz curve, so that the closer the curvature is to a straight line, the less uneven the location will be. represented. In this sense, the Gini coefficient represents the relationship between the value of concentration area indicated and the total area of the right triangle formed.
The main advantage of the Gini index is its ability to measure the distribution of income, not giving in to the limitations of other data, such as per capita income, which is nothing more than the arithmetic average between the Gross National Product and the number of population. In addition, this data is positive in the sense of being easily interpreted and thus providing a greater notion of the reality in question, even allowing the comparison between different periods and places.
between the Disadvantages of Gini Index, we can highlight the fact that it measures income inequality in static terms, without emphasizing the opportunity or potential that a place has to become more or less unequal in the short and long term deadline. Furthermore, a good distribution of income in a country, for example, does not necessarily correspond to social justice, as this index does not take into account the purchasing power that an income X can present in different parts of the same territory.
Do not stop now... There's more after the advertising ;)
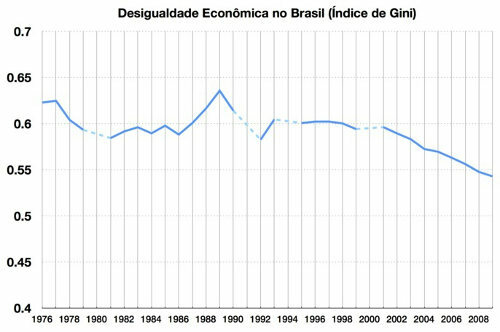
In any case, the relevance of this indicator in measuring, even generically, the conditions of population income distribution is accentuated. If we consider the historical data for the Gini Index of Brazil, we can see that, from the 1990s onwards, above all at the beginning of the 2000s, a sharp process of improvement began in their numbers, which are increasingly reduced.

Graph showing the evolution of the Gini Index in recent years in Brazil
However, this improvement is relative, since, if we consider the territorial division of labor between the countryside and the city, the difference in values is striking. In 2010, according to data from the Institute for Applied Economic Research (Ipea), the Gini Index in rural areas Brazilian was 0.727, while the same general data for the country was 0.533, which also highlights the issue gives land concentration.
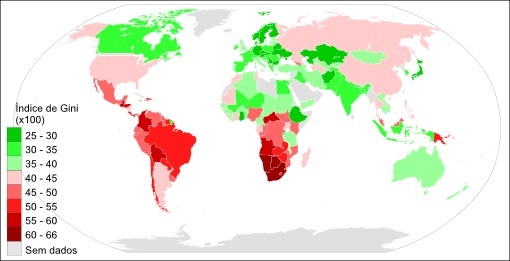
It is also worth analyzing the values of the Gini index in the world, as well as the insertion of Brazil in this panorama. However, it is complicated to carry out a global comparison of this data, as there is no information about it in many existing countries. In any case, despite recent advances, Brazil's Gini Index is one of the worst in the world, far removed from the first placed, such as Hungary (0.244), Denmark (0.247) and Japan (0.249). Among the 127 countries analyzed, Brazil is in the uncomfortable 120th position according to data from the World Bank, although it presents prospects for evolution.

World map regionalized based on the Gini Index **
_____________________________
* Image credits: Avsa / Wikimedia Commons
** Image credits: M Tracy Hunter / Wikimedia Commons
By Me. Rodolfo Alves Pena

